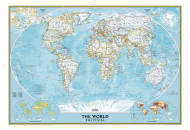
World Maps serve various purposes as they contain a storehouse of information. Besides detailing about the various countries of the world, the map also gives the onlooker an idea about the location of the country and the different countries that surround it.
There are various types of world maps and depending on your requirement, you can take a glance at the different types of maps. Blank World Maps can be useful to students as this can be used for map plotting exercises. World time zone maps help a person to keep an eye on the time zones prevailing in various parts of the world at any given time. A glimpse at the world economy maps can give the onlooker an idea about the economic status of the world by indicating the GDP and other economic patterns.
|
The World at a Glance Total Area: 149,000,000 sq km (57,529,222 sq miles) Population: 6,785,259,319 (2009 estimated) Population density: 45/sq km (116.5/sq miles) GDP: Total: USD 70.650 trillion (2008 estimate) Per capita: USD 9,600 GDP (nominal) (2007 estimate): USD 55 trillion Per Capita: USD 8,100 Human Development Index (HDI): 0.753 (2007) Circumference: 40,075.02 km (equatorial) 40,007.86 km (meridional) 40,041.47 km (mean) |
Physical Characteristics: Mean Radius: 6,371.0 km Equatorial Radius: 6,378.1 km Polar Radius: 6,356.8 km Flattening: 0.0033528 Surface Area: 510,072,000 sq km 148,940,000 sq km land (29.2 %) 361,132,000 sq km water (70.8 %) Volume: 1.0832073 x 10¹² cubic km Mass: 5.9736 x 1024 kg Mean Density: 5.5153 g/cubic cm Equatorial Surface Gravity: 9.780327 m/s2 Escape Velocity: 11.186 km/s Sidereal Rotation Period: 0.99726968 days (23h 56m 4.100s) Equatorial Rotation Velocity: 1,674.4 km/h (465.1 m/s) Axial Tilt: 23.439281° |
A look at the map suggests that people of South East Asia saw the maximum growth in the purchasing capacity. Russia, eastern parts of Europe and western parts of Africa, on the other hand saw the least improvement with respect to individual purchasing capacity.


