What countries rank high on the Enabling Trade Index?
Free trade is a prominent driver of the global economic development as well as social progress. Healthy trade promotes competition and enables technologies. It also allows nations to specialize and ideas to spread. These factors play a crucial role in boosting productivity as well as innovation which ultimately leads to the economic growth.
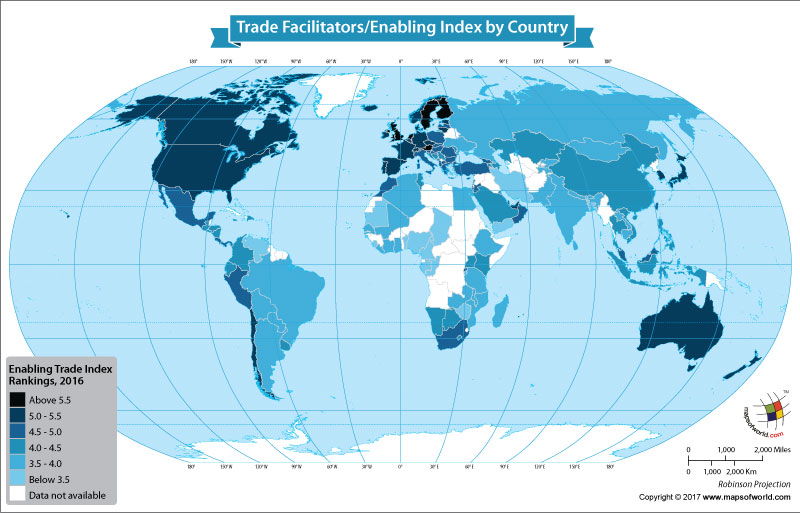
Every two years, the World Economic Forum releases the Enabling Trade Index as a part of the Global Enabling Trade Report. The index, which has been published since 2008, measures the extent to which nations have in place the factors that facilitate the free flow of goods over borders and destinations. The four sub-indexes, which comprise the Enabling Trade Index, are market access, border administration, infrastructure and operating environment. These sub-indexes further have pillars which measure the various aspects of the trade environment of a nation. The 2016 Enabling Trade Index ranks 136 economies on a scale of 1 to 7.
According to the 2016 Enabling Trade Index, Singapore is the best performing nation with a score of 5.97. The report states that Singapore has one of the world’s most open domestic market. The Number two spot went to the Netherlands, which had a score of 5.70, while Hong Kong SAR was at the third place and had a score of 5.66. The other top performing nations with scores of above 5.5 were Luxembourg, Sweden, Finland, Austria, and the United Kingdom.
Germany, Belgium, Switzerland, France, Spain, Japan, the United States, New Zealand, the United Arab Emirates, Australia, Canada, and some other nations scored between 5 and 5.5. Among the African nations, Mauritius was the top performer with a score of 4.89.
Among the BRICS nations, the leading country was South Africa scoring 4.52, while Russia was the least performing, scoring just 3.79. Brazil, India and China had scores of 3.80, 3.91 and 4.49. Nevertheless, the report states that the three BRICS nations of India, China, and South Africa have witnessed an improvement in their rankings as compared to the previous edition.
Nations that had scores of less than 3.5 included Burundi, Zimbabwe, Nigeria, Chad, Bangladesh, Iran and others. Meanwhile, the South American nation of Venezuela was placed at the bottom of the table with a score of 2.85.
The table below provides information on how nations have scored on the 2016 Enabling Trade Index
| Rank | Economy | Score (1-7) |
|---|---|---|
| 1 | Singapore | 5.97 |
| 2 | Netherlands | 5.7 |
| 3 | Hong Kong SAR | 5.66 |
| 4 | Luxembourg | 5.63 |
| 5 | Sweden | 5.61 |
| 6 | Finland | 5.6 |
| 7 | Austria | 5.52 |
| 8 | United Kingdom | 5.52 |
| 9 | Germany | 5.49 |
| 10 | Belgium | 5.45 |
| 11 | Switzerland | 5.45 |
| 12 | Denmark | 5.42 |
| 13 | France | 5.37 |
| 14 | Estonia | 5.32 |
| 15 | Spain | 5.28 |
| 16 | Japan | 5.28 |
| 17 | Norway | 5.27 |
| 18 | New Zealand | 5.27 |
| 19 | Iceland | 5.27 |
| 20 | Ireland | 5.27 |
| 21 | Chile | 5.26 |
| 22 | United States | 5.24 |
| 23 | United Arab Emirates | 5.23 |
| 24 | Canada | 5.15 |
| 25 | Czech Republic | 5.12 |
| 26 | Australia | 5.1 |
| 27 | Korea, Rep. | 5.04 |
| 28 | Portugal | 5.01 |
| 29 | Lithuania | 5.01 |
| 30 | Israel | 4.99 |
| 31 | Poland | 4.96 |
| 32 | Slovenia | 4.96 |
| 33 | Malta | 4.95 |
| 34 | Slovak Republic | 4.93 |
| 35 | Taiwan, China | 4.92 |
| 36 | Italy | 4.91 |
| 37 | Malaysia | 4.9 |
| 38 | Hungary | 4.89 |
| 39 | Mauritius | 4.89 |
| 40 | Latvia | 4.86 |
| 41 | Georgia | 4.8 |
| 42 | Bahrain | 4.79 |
| 43 | Qatar | 4.78 |
| 44 | Croatia | 4.76 |
| 45 | Jordan | 4.73 |
| 46 | Oman | 4.67 |
| 47 | Cyprus | 4.61 |
| 48 | Romania | 4.61 |
| 49 | Morocco | 4.6 |
| 50 | Rwanda | 4.59 |
| 51 | Mexico | 4.55 |
| 52 | Greece | 4.55 |
| 53 | Bulgaria | 4.54 |
| 54 | Peru | 4.54 |
| 55 | South Africa | 4.52 |
| 56 | Macedonia, FYR | 4.52 |
| 57 | Costa Rica | 4.52 |
| 58 | Panama | 4.52 |
| 59 | Turkey | 4.52 |
| 60 | Albania | 4.51 |
| 61 | China | 4.49 |
| 62 | Montenegro | 4.46 |
| 63 | Thailand | 4.45 |
| 64 | Serbia | 4.41 |
| 65 | Botswana | 4.41 |
| 66 | Uruguay | 4.37 |
| 67 | Saudi Arabia | 4.33 |
| 68 | Armenia | 4.32 |
| 69 | Guatemala | 4.32 |
| 70 | Indonesia | 4.3 |
| 71 | Azerbaijan | 4.3 |
| 72 | Brunei Darussalam | 4.27 |
| 73 | Vietnam | 4.26 |
| 74 | El Salvador | 4.25 |
| 75 | Namibia | 4.25 |
| 76 | Nicaragua | 4.24 |
| 77 | Kenya | 4.2 |
| 78 | Dominican Republic | 4.2 |
| 79 | Moldova | 4.2 |
| 80 | Lesotho | 4.15 |
| 81 | Ecuador | 4.14 |
| 82 | Philippines | 4.13 |
| 83 | Bosnia and Herzegovina | 4.12 |
| 84 | Uganda | 4.11 |
| 85 | Colombia | 4.1 |
| 86 | Honduras | 4.08 |
| 87 | Kuwait | 4.07 |
| 88 | Kazakhstan | 4.05 |
| 89 | Jamaica | 4.03 |
| 90 | Lebanon | 4.03 |
| 91 | Tunisia | 4.02 |
| 92 | Bhutan | 3.98 |
| 93 | Lao PDR | 3.98 |
| 94 | Argentina | 3.98 |
| 95 | Ukraine | 3.97 |
| 96 | Senegal | 3.97 |
| 97 | Zambia | 3.97 |
| 98 | Cambodia | 3.96 |
| 99 | Gambia | 3.95 |
| 100 | Ghana | 3.93 |
| 101 | Malawi | 3.93 |
| 102 | India | 3.91 |
| 103 | Sri Lanka | 3.9 |
| 104 | Mozambique | 3.88 |
| 105 | Côte d’Ivoire | 3.87 |
| 106 | Trinidad and Tobago | 3.86 |
| 107 | Paraguay | 3.86 |
| 108 | Nepal | 3.84 |
| 109 | Madagascar | 3.8 |
| 110 | Brazil | 3.8 |
| 111 | Russian Federation | 3.79 |
| 112 | Bolivia | 3.78 |
| 113 | Kyrgyz Republic | 3.76 |
| 114 | Tajikistan | 3.74 |
| 115 | Tanzania | 3.74 |
| 116 | Egypt | 3.72 |
| 117 | Ethiopia | 3.72 |
| 118 | Mali | 3.71 |
| 119 | Mongolia | 3.66 |
| 120 | Liberia | 3.53 |
| 121 | Algeria | 3.51 |
| 122 | Pakistan | 3.51 |
| 123 | Bangladesh | 3.48 |
| 124 | Benin | 3.48 |
| 125 | Burundi | 3.41 |
| 126 | Zimbabwe | 3.4 |
| 127 | Nigeria | 3.25 |
| 128 | Sierra Leone | 3.25 |
| 129 | Gabon | 3.24 |
| 130 | Cameroon | 3.2 |
| 131 | Mauritania | 3.18 |
| 132 | Iran | 3.16 |
| 133 | Democratic Republic of the Congo | 3.03 |
| 134 | Yemen | 2.95 |
| 135 | Chad | 2.93 |
| 136 | Venezuela | 2.85 |
Know more:
Related maps: