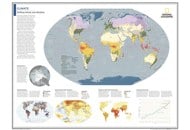
World Climate map shows climatic conditions prevailing in different parts of the world. Regions have been classified according to their main climate, precipitation and temperature.
Description : This map shows various climatic conditions prevailing in different parts of the world.
Disclaimer
Disclaimer : All efforts have been made to make this image accurate. However MapSherpa, Inc, its directors and employees do not own any responsibility for the correctness or authenticity of the same.
World Map Climate Zones
Although the daily weather map ushered in the modern meteorological sciences in the early 19 th Century, broader regional variations in terms of changes in climate and climatic conditions were represented cartographically for the first time in 1817 when Alexander von Humboldt produced a map showing the distribution of mean annual temperatures over the greater part of the Northern Hemisphere.
Humboldt used isothermal lines to map temperature; the first one to do so. Another early attempt was that of Alexander Buchan who made the first maps of mean monthly and annual pressure for the whole world. Then in 1886 Frenchman Leon-Philippe Teisserenc de Bort published maps showing mean annual cloudiness over the Earth for each month and the year. Earlier in 1882 Loomis created the first world precipitation map showing mean annual precipitation with the help of isohyets.
The first attempt to classify variations in overall climatic conditions could be traced to Aristotle's ancient though ill informed division of the world into Temperate, Torrid, and Frigid Zones. In the present-day, however, most classifications of world climatic types and world climate maps are based on the famous classification innovated by the German meteorologist and climatologist Wladimir Koppen.
Co-authored with his student Rudolph Geiger and introduced as a wall map in 1928, Koppen's world climate map was updated by Koppen several times in his life-time and modified by later climatologists, the most famous modification being that of late University of Wisconsin geographer Glen Trewartha.
The modified Koppen's world climate map makes use of six alphabets to divide the world into six climatic regions on the basis of average annual precipitation, average monthly precipitation, and average monthly temperature:
A Type or Tropical Humid
B Type or Dry
C Type or Mild-Mid Latitude
D Type or Severe Mid Latitude
E Type or Polar
H Type or Highland Climates
Each of the above categories is further sub-divided into 24 sub-categories on the basis of precipitation and temperature. For instance:
Type A climates include Wet Equatorial Climate (Af); Tropical Monsoon and trade-wind littoral climates (Am); and Tropical wet-dry climate (Aw)
Type B climates include Tropical and sub-tropical desert climate (Bwh, part of Bwk); Tropical and subtropical steppe climate (Bsh); and Mid-latitude steppe and desert climate (Bsk, part of Bwk)
Type C climates include Humid sub-tropical climate (Cfa, Cwa); Mediterranean climate (Csa, Csb); and Marine west coast climate (Cfb, Cfc)
Type D climates include Humid continental climate (Dfa, Dfb, Dwa, Dwb); and Continental subarctic climate (Dfc, Dfd, Dwc, Dwd)
Type E climates include Tundra Climate (ET) and Snow and ice climate (EF), and
Type H climate included the different climates in the highl;ands of the world with their local variations.
The world climate map based on Koppen's classification is therefore the most comprehensive, detailed and yet easily understood representation of the various climatic types in the world.
The word 'map' originated from the Latin word 'mappa' which meant a napkin or paper. Why so? Because these were the usual materials the earliest maps were drawn on.
Average Temperature in JulyAverage Temperature in JanuaryCurrents and Temperature in JanuaryCurrents and Temperature in JulyWorld Relief MapPrecipitation Rain And SnowRainforests of the WorldRiver Valley CivilizationsTropical Revolving Storm EnlargeTsunami ZonesWind And Pressure JanuaryAir Pressure and Wind in Julye