1998
Mapsofworld.com started its life journey as a site within a site. Mapsofindia.com had a module which was called Maps of World. By 1999, the visitors had started showing interest in the maps we were putting up. Between 1999-to-2004, the world map section in Mapsofindia.com grew several times, to the extent that it was felt that world maps were diluting the theme of Mapsofindia.com.
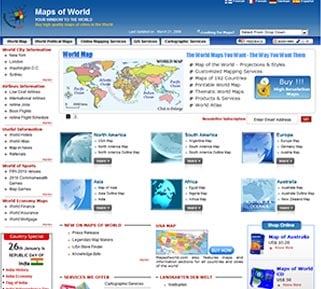
At that stage, it was considered prudent to move the world section of MapsofIndia.com to another site, and that's when Mapsofworld.com was started.
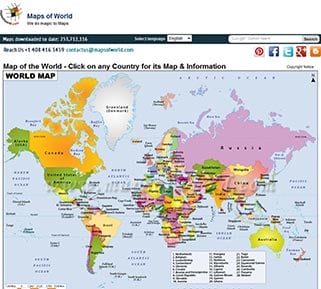
2004
MOW took a baby step with the start of just one world map. A few months into it, MOW was collecting maps which included world, continent and thematic maps.
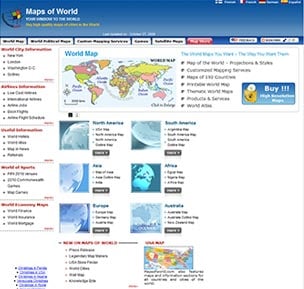
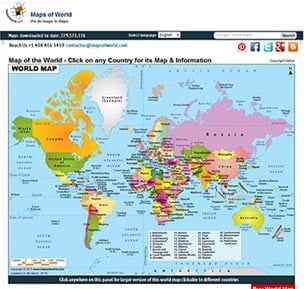
2005
We expanded the site including more thematic maps. To give our site a cutting edge, we also introduced profile pages of countries and flags of different nations. Targeting students and researchers, we also came up with political maps of countries of the world and sports-related maps.
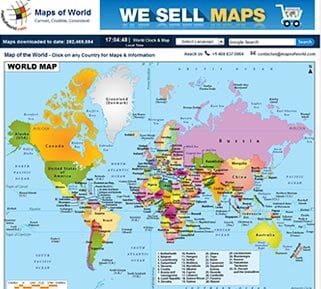
2006
By now, our efforts had started to show. MOW was becoming a known name and we were getting decent traffic on our portal. Banking on our success ratio, we took a step further and launched MOW CD. During the year, we also started the sales of printable maps, introduced city maps and US state pages and added utilities.
2007
We continued our expansion spree and during the year 2007, introduced top 10 maps, US thematic maps and physical maps of world and countries.
2008
In these years, we had gained enough accolades to give us the confidence to delve deeper. So, we experimented by introducing the Project concept in MOW, apart from many other products and themes. Thankfully, the experiments paid off.
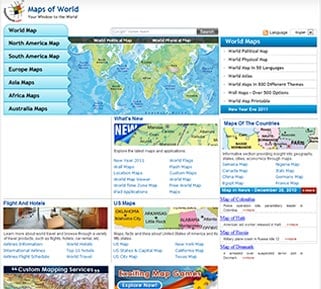
2009
The baby step that MOW took in 2004 had now become a giant footstep. By now, we had the manpower, technology and, above all, confidence to take things to new heights. So, we decided to bring to our site features that seemed a bit offbeat. The new things added were knowledge byte, country special segment, games, and more thematic information and maps. These helped us gain more customers.
2010
We began sending monthly newsletters to our clients informing them of the various projects we had undertaken in the past month. We also started a world blog channel, where we had blogs on various topics such as politics, science, education, and business to name a few.
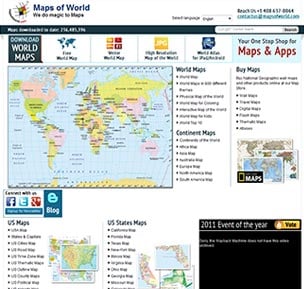
2011
This was a big year for us. We had become quite well-known and companies had begun to trust our expertise. We got a shot in the arm when Nat Geo tied up with us. Other than this, we also started apps and integrated a digital store with MOW.
2012
With our expertise growing, we decided to sell our maps to a much wider audience. So, we started sites in different languages. The result - our customer base increased. Another popular feature that we introduced this year was the 'Friday Poll', where we gave the readers rich information on global issues through infographics and accompanying content.
2013
Having already established our niche in the mapping and blog segment, we decided to delve into news and other content. So, we came up with 'Calendar Events', a daily dossier of news from all corners of the world and 'On This Day', a rich insight into what happened on a particular day in history. Other than this, we also started a travel section which displayed fabulous information along with breathtaking pictures about travel destinations from around the world.
2014
By now, being successful had become a habit. So, we decided to further expand our site by including more travel content, San Francisco and city maps and extensive sports coverage. To further cement our relationship with the US reader, we also started an infographic on US food, 'Mmmerica'.
2015
The world blog channel had become quite popular and the quest for information was expanding at an exponential rate. So, we started another blog 'Around the World' where we could provide the reader with current and trending information. Another major project of the year was store integration in MOW. We also increased our focus on maps, information, store and travel. We also started making videos and did quite an amazing job.
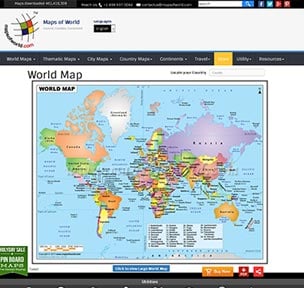
2016
Maps and content - was, is and always will be our prime focus. So, to increase our reach and gain traction, we experimented with the concepts of mobile responsive and action buttons.
2017
Bringing the most updated content, we worked on answering the most sought questions with upto the minute information. Touching new horizons, we addressed the global issues, each attached with self-explanatory map and elaborated, well-sorted data tables. This has helped us harbor our user's convenience and fostered the imparting of accurate information.