World Industrial Production Growth Rate Map
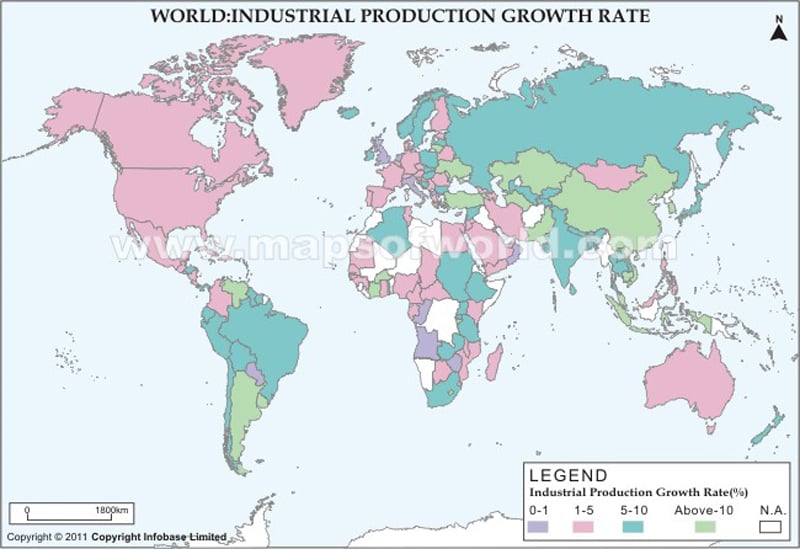
The map of World Industrial Production Growth Rate gives the annual percentage increase in industrial production which includes manufacturing, mining, and construction.
| Description : This map indicates the growth rate of industrial production in different parts of the world. |
Disclaimer
|
Close Disclaimer : All efforts have been made to make this image accurate. However MapSherpa, Inc, its directors and employees do not own any responsibility for the correctness or authenticity of the same. |
| Rank | Country | Industrial production growth rate(%) |
| 1 | Cambodia | 22 |
| 2 | Turkmenistan | 22 |
| 3 | Uruguay | 22 |
| 4 | Burundi | 18 |
| 5 | China | 17.1 |
| 6 | Moldova | 17 |
| 7 | Turkey | 16.5 |
| 8 | Ukraine | 16.5 |
| 9 | Vietnam | 16 |
| 10 | Lesotho | 15.5 |
| 11 | Armenia | 15 |
| 12 | Cote d'Ivoire | 15 |
| 13 | Burkina Faso | 14 |
| 14 | Pakistan | 13.1 |
| 15 | Venezuela | 12.3 |
| 16 | Taiwan | 12.2 |
| 17 | Argentina | 12 |
| 18 | Lithuania | 12 |
| 19 | Kazakhstan | 10.6 |
| 20 | Indonesia | 10.5 |
| 21 | Malaysia | 10.2 |
| 22 | Korea, South | 10.1 |
| 23 | Ecuador | 10 |
| 24 | Poland | 10 |
| 25 | Qatar | 10 |
| 26 | Laos | 9.7 |
| 27 | Hungary | 9.6 |
| 28 | Bhutan | 9.3 |
| 29 | Iceland | 8.8 |
| 30 | Nepal | 8.7 |
| 31 | Latvia | 8.5 |
| 32 | Sudan | 8.5 |
| 33 | Thailand | 8.5 |
| 34 | Tanzania | 8.4 |
| 35 | Benin | 8.3 |
| 36 | Tajikistan | 8.2 |
| 37 | Chile | 7.8 |
| 38 | Honduras | 7.7 |
| 39 | India | 7.4 |
| 40 | Sri Lanka | 7.1 |
| 41 | Guyana | 7.1 |
| 42 | Ireland | 7 |
| 43 | Syria | 7 |
| 44 | Rwanda | 7 |
| 45 | Zambia | 6.9 |
| 46 | Ethiopia | 6.7 |
| 47 | Japan | 6.6 |
| 48 | Bangladesh | 6.5 |
| 49 | Suriname | 6.5 |
| 50 | Russia | 6.4 |
| 51 | Uzbekistan | 6.2 |
| 52 | Kyrgyzstan | 6 |
| 53 | Algeria | 6 |
| 54 | Brazil | 6 |
| 55 | New Zealand | 5.9 |
| 56 | Bolivia | 5.7 |
| 57 | Uganda | 5.6 |
| 58 | Bosnia and Herzegovina | 5.5 |
| 59 | South Africa | 5.5 |
| 60 | Sweden | 5.5 |
| 61 | Panama | 5.4 |
| 62 | Bulgaria | 5.2 |
| 63 | Norway | 5.2 |
| 64 | Peru | 5.2 |
| 65 | Slovakia | 5.1 |
| 66 | Brunei | 5 |
| 67 | Philippines | 5 |
| 68 | Estonia | 5 |
| 69 | Jordan | 5 |
| 70 | Chad | 5 |
| 71 | Czech Republic | 4.7 |
| 72 | Senegal | 4.7 |
| 73 | Switzerland | 4.7 |
| 74 | Belize | 4.6 |
| 75 | Israel | 4.5 |
| 76 | Botswana | 4.4 |
| 77 | United States | 4.4 |
| 78 | Tunisia | 4.4 |
| 79 | Nicaragua | 4.4 |
| 80 | Cameroon | 4.2 |
| 81 | Greece | 4.1 |
| 82 | Mongolia | 4.1 |
| 83 | Guatemala | 4.1 |
| 84 | United Arab Emirates | 4 |
| 85 | Colombia | 4 |
| 86 | Azerbaijan | 4 |
| 87 | Belarus | 4 |
| 88 | Romania | 4 |
| 89 | Slovenia | 3.9 |
| 90 | Ghana | 3.8 |
| 91 | Mexico | 3.8 |
| 92 | Eswatini(Swaziland) | 3.7 |
| 93 | Belgium | 3.5 |
| 94 | Iran | 3.5 |
| 95 | Mozambique | 3.4 |
| 96 | Austria | 3.3 |
| 97 | Guinea | 3.2 |
| 98 | Albania | 3.1 |
| 99 | Costa Rica | 3.1 |
| 100 | Central African Republic | 3 |
| 101 | Djibouti | 3 |
| 102 | Georgia | 3 |
| 103 | Yemen | 3 |
| 104 | Spain | 3 |
| 105 | Madagascar | 3 |
| 106 | Luxembourg | 2.9 |
| 107 | Saudi Arabia | 2.8 |
| 108 | Croatia | 2.7 |
| 109 | Kenya | 2.6 |
| 110 | Guinea-Bissau | 2.6 |
| 111 | Egypt | 2.5 |
| 112 | Germany | 2.2 |
| 113 | Finland | 2 |
| 114 | Mauritania | 2 |
| 115 | Dominican Republic | 2 |
| 116 | Canada | 2 |
| 117 | Australia | 1.9 |
| 118 | Nigeria | 1.8 |
| 119 | Denmark | 1.7 |
| 120 | France | 1.7 |
| 121 | Serbia and Montenegro | 1.7 |
| 122 | Gabon | 1.6 |
| 123 | Cuba | 1.4 |
| 124 | Malawi | 1.4 |
| 125 | Portugal | 1.1 |
| 126 | Angola | 1 |
| 127 | United Kingdom | 0.9 |
| 128 | Netherlands | 0.8 |
| 129 | El Salvador | 0.7 |
| 130 | Italy | 0.7 |
| 131 | Cyprus | 0.4 |
| 132 | Congo, Republic of the | 0 |
| 133 | Paraguay | 0 |
| 134 | Macedonia, The Former Yugoslav Republic of | 0 |
| 135 | Cyprus | -0.3 |
| 136 | Oman | -1.2 |
| 137 | Jamaica | -2 |
| 138 | Kuwait | -5 |
| 139 | Zimbabwe | -7.8 |


