Rutile is a mineral composed primarily of titanium dioxide, though natural rutile may contain about ten percent iron and small amounts of niobium and tantalum. Generally of deep red color, rutile is also found in hues of reddish brown, pale yellow, pale blue, violet, and grass-green.
Rutile is usually found in high-temperature and high-pressure metamorphic rocks and in igneous rocks. Sometimes, it is also found in altered igneous rocks, and in certain gneisses and schists. . It is also associated with quartz, hematite and feldspar. It is also common in beach sand deposits, along with the other titanium mineral, ilmenite.
The most use of rutile is in the manufacture of refractory ceramic, as a pigment in paints, paper, foods, and for the production of titanium metal. Rutile is widely used as a welding electrode covering.
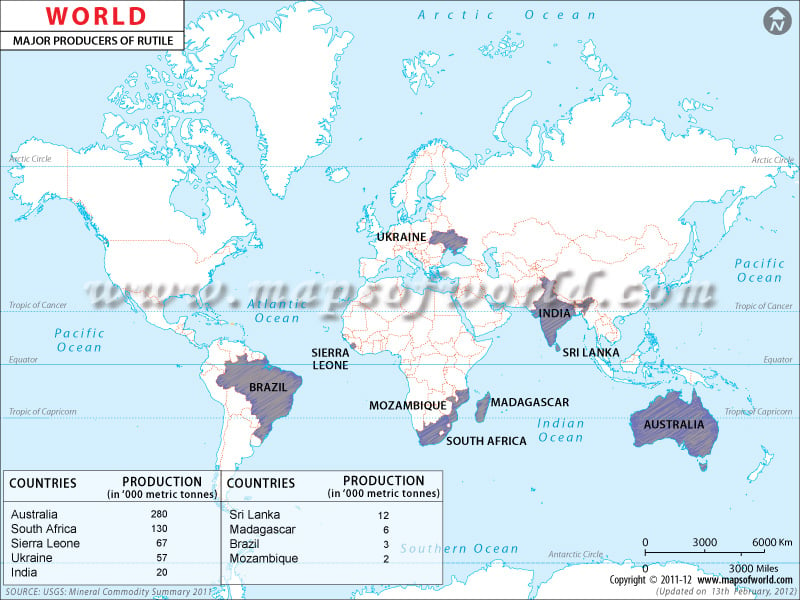
The World Map of Rutile Producers shows a list of the countries that produce large quantities of rutile. As the data in the map shows, Australia leads the world in the production of rutile; in 2010, the country produced 2.8 million metric tonnes of rulite.
The second-largest rulite producer in the world is South Africa with an annual production of 1.3 million metric tonnes.
Sierra Leone ranks third in the annual production of rutile. Other important countries producing rutile are: Ukraine, India, Sri Lanka, Madagascar, Brazil, and Mozambique.
Rutile is also widely both to preserve fruits and vegetables and to remove pollution.
Major Producers of Rutile in world-2010
| Country | Production in Thousand Metric Tonnes |
| Australia | 280 |
| South Africa | 130 |
| Sierra Leone | 67 |
| Ukraine | 57 |
| India | 20 |
| Sri Lanka | 12 |
| Madagascar | 6 |
| Brazil | 3 |
| Mozambique | 2 |
