How much is the merchandise trade (in percentage of GDP) around the world?
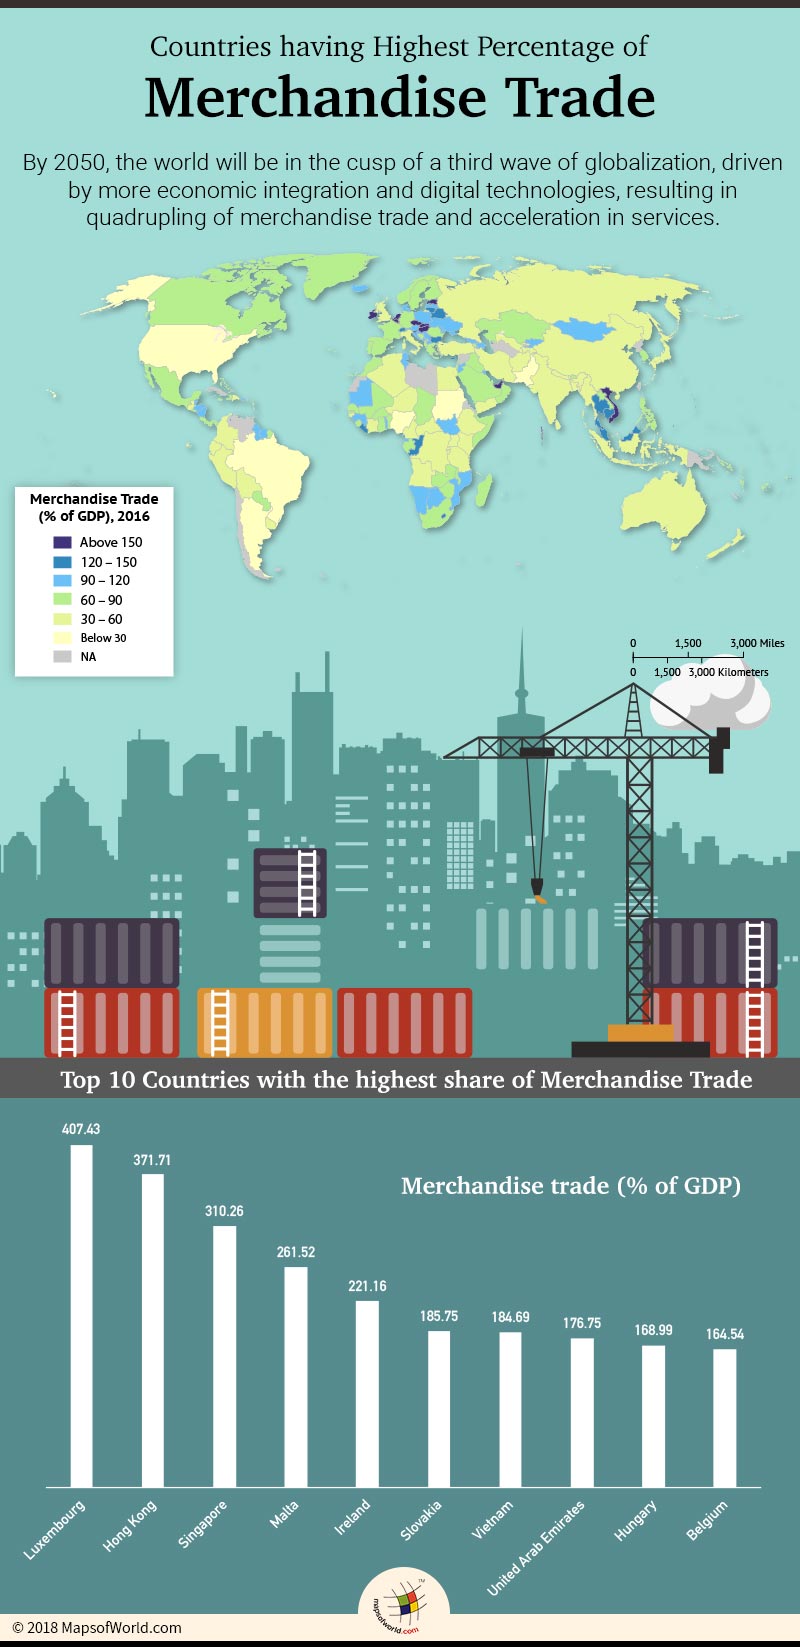
The ‘Trade Winds’ report produced by Oxford Economics on behalf of HSBC Bank, gives insight in the future global trends; “By 2050, the world will be on the cusp of a third wave of globalization, driven by more economic integration and digital technologies, resulting in quadrupling of merchandise trade and acceleration in services.”
The merchandise trade is the international transactions of goods that are tangible and movable. This differs from the international trade as the latter includes imports and exports of both goods and services. The World Trade Organization, anticipates the world merchandise trade volume growth, of 4.4%, as a measure of the average of exports and imports. In the face of a globalized economy, this expansion is also determined by the government fiscal, monetary and trade policies.
The cyclic factors of investment and consumption have resulted in an exceptional surge during the six years leading up to 2017. Contributing elements to the balance of trade are: factors of production, trade policy, exchange rates, foreign currency reserves, inflation and demand. Factors such as land, labor & capital, and the difference in availability in a country defines trade patterns. Whereas barriers to trade and restrictive trade policies affect the relative price of the merchandise.
The appreciation of currency can hurt exports, thus negatively impacting exports of a nation. Additionally, in order to produce globally competitive products, a country should have enough Forex reserves to afford the leading technologies. Hence these factors shape the global trade of merchandise positively or negatively.
The Balance of Trade is a key indicator of an economy’s health. The varying impacts of international merchandise trade on the global economy are the opening of global markets to the consumers offering price and product options on one hand and efficient production leading to specialization to the producers on the other. The economies thus have a comparative advantage: each country specializes in producing what they are more efficient in producing.
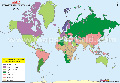
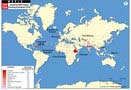
The world’s top traded merchandise includes crude oil, pharmaceuticals, automobiles, iron ore and smartphones. Countries like Luxembourg, Hong Kong and Singapore account for the highest merchandise trade. Luxembourg, a landlocked western European nation surrounded by economic powerhouses, is a leading exporter of machinery, iron and steel and plastic articles. This has fostered the economic growth in this nation. In case of Hong Kong, the recovery from the global economic crisis and trade supporting services from Chinese mainland, has hiked the offshore sale of goods.
Countries like Nigeria, Brazil and Pakistan, on the other hand, account for the lowest share of merchandise trade (% of GDP). Nigeria shows an increase in the merchandise trade in the fourth quarter of 2017, but is still the lowest trading economy. In case of Pakistan, the country’s trade deficit hit an ever low in 2017. A decline in exports accompanied with inefficient policies of import substitution led the country into a lower trading practice.
Below lying table depicts the countries and their share of merchandise trade (% of GDP)-:
|
Country Name |
2016 (Merchandise |
Country Name |
2016 (Merchandise |
|
|
Luxembourg |
407.43 |
Sierra Leone |
79.42 |
|
|
Hong Kong |
371.71 |
Samoa |
79.19 |
|
|
Singapore |
310.26 |
Portugal |
79.14 |
|
|
Malta |
261.52 |
Fiji |
77.99 |
|
|
Ireland |
221.16 |
Malawi |
77.91 |
|
|
Slovakia |
185.75 |
South Korea |
77.71 |
|
|
Vietnam |
184.69 |
Somalia |
77.35 |
|
|
United Arab Emirates |
176.75 |
Oman |
76.81 |
|
|
Hungary |
168.99 |
Jamaica |
76.30 |
|
|
Belgium |
164.54 |
Mexico |
76.22 |
|
|
American Samoa |
158.51 |
Armenia |
75.92 |
|
|
Estonia |
154.10 |
Laos |
75.09 |
|
|
Netherlands |
153.89 |
Albania |
74.67 |
|
|
Czech Republic |
151.60 |
Palestinian |
74.54 |
|
|
Nauru |
150.55 |
Kosovo |
74.20 |
|
|
Maldives |
150.27 |
Zambia |
73.96 |
|
|
Lithuania |
147.61 |
Bahamas |
73.49 |
|
|
Slovenia |
146.15 |
Iraq |
73.42 |
|
|
Northern Mariana Islands |
145.49 |
Haiti |
73.34 |
|
|
Bahrain |
139.55 |
Senegal |
72.91 |
|
|
Republic of the Congo |
136.52 |
Finland |
72.81 |
|
|
Cyprus |
130.20 |
Lebanon |
72.61 |
|
|
Malaysia |
128.64 |
El Salvador |
71.96 |
|
|
Cambodia |
126.95 |
Benin |
71.31 |
|
|
Palau |
126.21 |
Gabon |
71.16 |
|
|
Lesotho |
125.38 |
Guam |
70.57 |
|
|
Belarus |
125.21 |
Madagascar |
69.26 |
|
|
Bulgaria |
123.64 |
Chad |
67.86 |
|
|
Central Europe and the Baltics |
123.60 |
Norway |
67.41 |
|
|
Liberia |
121.69 |
Philippines |
64.90 |
|
|
Thailand |
121.66 |
Gambia, The |
64.88 |
|
|
Switzerland |
120.40 |
Costa Rica |
64.76 |
|
|
Latvia |
119.19 |
Canada |
64.35 |
|
|
South Sudan |
116.70 |
Zimbabwe |
63.33 |
|
|
Macedonia |
114.68 |
Spain |
62.88 |
|
|
Moldova |
114.60 |
Mali |
62.41 |
|
|
St. Kitts and Nevis |
113.51 |
Burkina Faso |
62.02 |
|
|
Marshall Islands |
111.45 |
Saudi Arabia |
61.86 |
|
|
Guinea |
110.97 |
Greece |
61.64 |
|
|
Mozambique |
110.82 |
France |
61.13 |
|
|
Macao |
110.59 |
South Africa |
60.79 |
|
|
Belize |
110.20 |
Kazakhstan |
60.31 |
|
|
Puerto Rico |
109.66 |
Comoros |
59.69 |
|
|
Grenada |
108.47 |
Democratic Republic of the Congo |
59.59 |
|
|
Serbia |
107.50 |
Angola |
59.43 |
|
|
Kiribati |
106.71 |
United Kingdom |
58.58 |
|
|
Kyrgyzstan |
105.82 |
Israel |
58.45 |
|
|
Togo |
105.63 |
Guinea-Bissau |
57.81 |
|
|
Namibia |
105.10 |
Bolivia |
56.40 |
|
|
Ukraine |
104.81 |
Italy |
56.35 |
|
|
Suriname |
104.10 |
Algeria |
56.27 |
|
|
Montenegro |
103.38 |
Tajikistan |
56.05 |
|
|
Georgia |
102.93 |
Afghanistan |
55.92 |
|
|
Dominica |
102.33 |
Dominican Republic |
53.84 |
|
|
Swaziland |
102.20 |
Sub-Saharan Africa |
52.58 |
|
|
Austria |
101.17 |
New Zealand |
51.32 |
|
|
Denmark |
100.97 |
Sri Lanka |
50.01 |
|
|
Mauritania |
100.53 |
Cote d’Ivoire |
49.52 |
|
|
Honduras |
100.49 |
Niger |
49.37 |
|
|
Poland |
100.47 |
Nepal |
48.88 |
|
|
Guyana |
100.33 |
Rwanda |
48.03 |
|
|
Federated States of Micronesia |
99.02 |
Uganda |
47.22 |
|
|
Mauritius |
98.43 |
Guatemala |
47.00 |
|
|
Cabo Verde |
97.96 |
Turkey |
46.82 |
|
|
Botswana |
97.13 |
Russia |
46.23 |
|
|
Mongolia |
95.64 |
Peru |
45.25 |
|
|
Croatia |
95.21 |
Iran |
43.21 |
|
|
Nicaragua |
95.10 |
Central African Republic |
42.75 |
|
|
Kuwait |
94.66 |
Tanzania |
42.33 |
|
|
Equatorial Guinea |
92.50 |
Cameroon |
42.00 |
|
|
Tunisia |
91.44 |
Uruguay |
41.31 |
|
|
St. Vincent and the Grenadines |
91.34 |
Australia |
40.77 |
|
|
Jordan |
91.32 |
India |
40.35 |
|
|
Iceland |
90.42 |
Uzbekistan |
39.62 |
|
|
Azerbaijan |
90.08 |
Timor-Leste |
39.28 |
|
|
Tonga |
89.43 |
Myanmar |
39.06 |
|
|
Ghana |
89.34 |
Ecuador |
38.83 |
|
|
Qatar |
89.11 |
Burundi |
38.16 |
|
|
Antigua and Barbuda |
88.73 |
Bangladesh |
37.95 |
|
|
Bosnia and Herzegovina |
87.70 |
Indonesia |
37.44 |
|
|
Brunei Darussalam |
87.32 |
China |
37.03 |
|
|
Panama |
87.28 |
Kenya |
36.75 |
|
|
Pacific island small states |
85.77 |
Colombia |
36.47 |
|
|
Greenland |
84.92 |
Ethiopia |
35.51 |
|
|
Djibouti |
84.65 |
Yemen |
33.53 |
|
|
Euro area |
84.27 |
Japan |
31.27 |
|
|
Germany |
84.27 |
Egypt |
30.02 |
|
|
Sweden |
83.71 |
North America |
30.01 |
|
|
Romania |
83.57 |
United States of America |
26.58 |
|
|
European Union |
82.87 |
Argentina |
26.12 |
|
|
Bhutan |
82.81 |
Pakistan |
25.31 |
|
|
Barbados |
82.62 |
Brazil |
24.57 |
|
|
Arab World |
81.96 |
Sudan |
22.36 |
|
|
Paraguay |
81.27 |
Nigeria |
20.72 |
|
|
Morocco |
80.42 |
Know more:
Related maps: