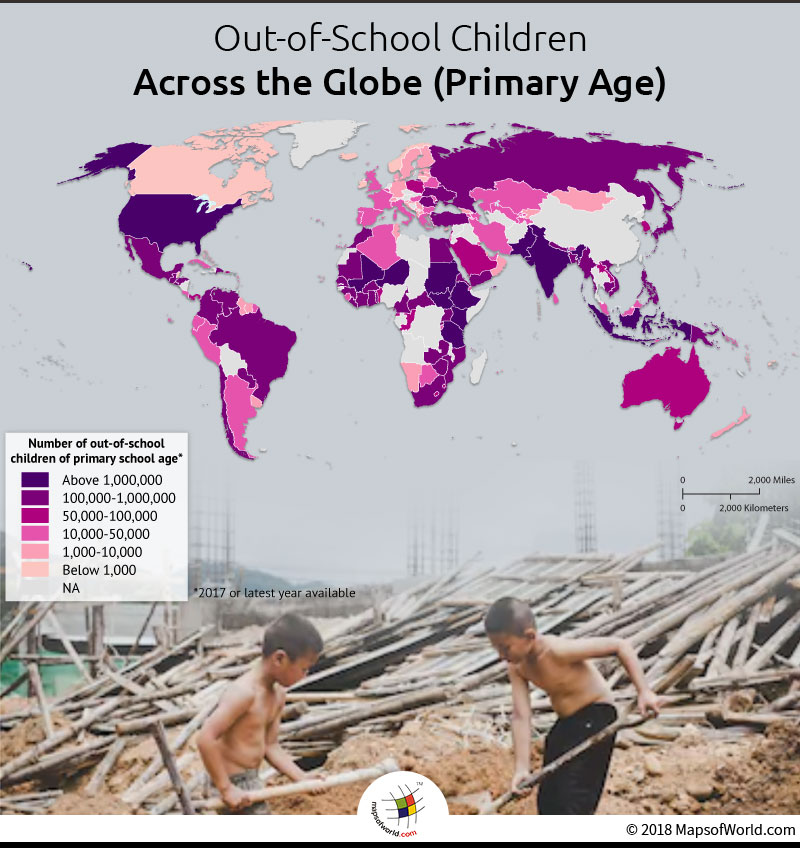
How many primary-age children are out-of-school?
 Education is the right of every child, but in some countries around the world, a significant percentage of the child population is denied this very basic right. A number of factors contribute to children not enrolling in schools in these countries. One of the many factors being the economic instability prevailing in the country or the nation being affected by war or violence.
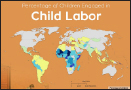
Some other factors that play a significant role is inability of people to afford education because of extreme poverty. In that case, children are often forced to work to support families. Many times, children are unable to understand the language in which education is imparted, as it could be different from their regional dialect. Gender impartiality is quite prevalent as well. Many societies discourage girls from going to school or the scourge of child marriage keeps them away from education. Sometimes, young girls are not sent school or are unable to continue further education as their schools, especially the ones in remote areas, do not have basic amenities such as toilets or washrooms.
The figures on the number of children denied of a basic education are alarming. According to a UNESCO data, sourced across 15 years – from 2000-2017 – there are about 38 million children around the world who have not enrolled in school at primary age. These are typically aged between 6 and 11 years. This staggering figure indicates that today, about 1 out of 11 of children is denied basic education.
The report paints an alarming picture of the Sub-Saharan Africa region. If broken down by gender, girls fare much worse than boys in this region. About 50 % of the total population of children, is not getting access to education. Coming at the second spot is southern Asia; however, it is way behind Africa. When considered out-of-children population amid countries, it is the Asian country of Pakistan and India that has the highest number of out-of-school children. As per 2017 census of Pakistan, whopping 5,324,181 people have not been enrolled in schools, whereas in India, according to its 2013 census, has 2,897,747 children outside of school.
Children are the future of a nation and the foundation of future of the country lies on the education imparted to each and every child. Governments continue to work towards betterment of educational facilities, but the circumstances are quite bitter till date. Its the European countries and the islands of Fiji, Tuvalu, Tokelau, Liechtenstein, Tonga, Palau etc. which have very less number of children who haven’t been enrolled in the education system. It is however apparent, that the population in an area also contributes to the availability of educational facilities for all.
Table below mentions the primary aged population enrolled out of schools in countries around the world:
| Country | Number of out-of-school children of primary school age |
Year |
|---|---|---|
| Pakistan | 5,324,181.0 | 2017 |
| India | 2,897,747.0 | 2013 |
| Sudan | 2,519,713.0 | 2016 |
| Ethiopia | 2,221,454.0 | 2015 |
| Tanzania | 2,207,255.0 | 2017 |
| Indonesia | 2,061,360.0 | 2017 |
| South Sudan | 1,297,786.0 | 2015 |
| Niger | 1,223,142.0 | 2017 |
| Kenya | 1,214,199.0 | 2012 |
| Mali | 1,037,948.0 | 2017 |
| United States of America | 1,013,950.0 | 2016 |
| Bangladesh | 753,254.0 | 2017 |
| Burkina Faso | 746,623.0 | 2017 |
| Mozambique | 728,531.0 | 2017 |
| Uganda | 714,319.0 | 2013 |
| Yemen | 703,884.0 | 2016 |
| Senegal | 628,099.0 | 2017 |
| Ghana | 622,861.0 | 2017 |
| South Africa | 620,845.0 | 2015 |
| Philippines | 586,284.0 | 2016 |
| Venezuela | 485,756.0 | 2017 |
| Liberia | 468,085.0 | 2016 |
| Eritrea | 437,315.0 | 2017 |
| Côte d’Ivoire | 419,597.0 | 2017 |
| Guinea | 406,478.0 | 2016 |
| Zimbabwe | 398,579.0 | 2013 |
| Brazil | 395,798.0 | 2016 |
| Zambia | 363,385.0 | 2013 |
| Guatemala | 298,432.0 | 2016 |
| Turkey | 294,314.0 | 2016 |
| Papua New Guinea | 254,607.0 | 2016 |
| Colombia | 243,808.0 | 2017 |
| Central African Republic | 232,452.0 | 2012 |
| Honduras | 192,262.0 | 2017 |
| Cameroon | 185,386.0 | 2017 |
| Cambodia | 184,824.0 | 2017 |
| Paraguay | 169,579.0 | 2016 |
| Egypt | 163,886.0 | 2017 |
| Nepal | 159,211.0 | 2017 |
| Dominican Republic | 154,709.0 | 2016 |
| Mauritania | 153,801.0 | 2017 |
| Russia | 146,591.0 | 2016 |
| Mexico | 139,577.0 | 2016 |
| El Salvador | 131,351.0 | 2017 |
| Vietnam | 127,071.0 | 2013 |
| Ukraine | 122,010.0 | 2014 |
| Japan | 118,248.0 | 2016 |
| Morocco | 117,890.0 | 2017 |
| Rwanda | 115,483.0 | 2017 |
| Myanmar | 109,055.0 | 2017 |
| Chile | 105,592.0 | 2016 |
| Romania | 104,542.0 | 2016 |
| Togo | 103,487.0 | 2017 |
| Poland | 99,207.0 | 2016 |
| South Korea | 95,530.0 | 2016 |
| Republic of the Congo | 90,113.0 | 2012 |
| Equatorial Guinea | 84,627.0 | 2015 |
| Saudi Arabia | 80,255.0 | 2014 |
| Gambia | 72,584.0 | 2017 |
| Australia | 69,193.0 | 2016 |
| Lesotho | 64,711.0 | 2017 |
| Lebanon | 61,661.0 | 2017 |
| Eswatini | 54,963.0 | 2016 |
| Panama | 53,667.0 | 2015 |
| Puerto Rico | 53,593.0 | 2015 |
| Benin | 52,737.0 | 2017 |
| Laos | 50,332.0 | 2017 |
| Greece | 48,705.0 | 2016 |
| Burundi | 45,208.0 | 2017 |
| Spain | 42,849.0 | 2016 |
| Timor-Leste | 42,619.0 | 2017 |
| Malaysia | 41,794.0 | 2017 |
| Iran | 41,355.0 | 2015 |
| Djibouti | 39,611.0 | 2017 |
| Ecuador | 39,278.0 | 2017 |
| Italy | 39,161.0 | 2016 |
| France | 37,422.0 | 2016 |
| Azerbaijan | 34,961.0 | 2017 |
| Botswana | 33,883.0 | 2014 |
| Uzbekistan | 33,682.0 | 2017 |
| Palestine | 30,443.0 | 2017 |
| Solomon Islands | 28,887.0 | 2017 |
| Argentina | 28,723.0 | 2016 |
| Israel | 25,499.0 | 2016 |
| Peru | 23,256.0 | 2017 |
| Portugal | 21,663.0 | 2016 |
| Algeria | 21,362.0 | 2017 |
| Cuba | 21,346.0 | 2017 |
| Comoros | 19,325.0 | 2017 |
| Kuwait | 19,258.0 | 2017 |
| Bulgaria | 18,895.0 | 2016 |
| Bhutan | 18,367.0 | 2017 |
| Belarus | 16,598.0 | 2017 |
| Moldova | 15,706.0 | 2017 |
| Costa Rica | 13,887.0 | 2016 |
| Armenia | 12,282.0 | 2017 |
| Hungary | 12,152.0 | 2016 |
| Sri Lanka | 12,056.0 | 2017 |
| United Arab Emirates | 11,902.0 | 2016 |
| Tajikistan | 11,435.0 | 2017 |
| Kazakhstan | 11,270.0 | 2017 |
| United Kingdom | 11,014.0 | 2016 |
| Belgium | 10,325.0 | 2016 |
| Sierra Leone | 10,119.0 | 2016 |
| Macedonia | 9,608.0 | 2015 |
| Cabo Verde | 9,073.0 | 2017 |
| Namibia | 8,724.0 | 2017 |
| Kyrgyzstan | 6,773.0 | 2017 |
| Germany | 6,133.0 | 2016 |
| New Zealand | 5,637.0 | 2016 |
| Estonia | 5,385.0 | 2016 |
| Vanuatu | 5,103.0 | 2015 |
| Uruguay | 4,858.0 | 2016 |
| Albania | 4,665.0 | 2017 |
| Denmark | 4,537.0 | 2016 |
| Oman | 4,477.0 | 2017 |
| Guyana | 4,303.0 | 2012 |
| Croatia | 4,007.0 | 2016 |
| Latvia | 3,890.0 | 2016 |
| Serbia | 3,860.0 | 2017 |
| Bahamas | 3,740.0 | 2016 |
| Tunisia | 3,675.0 | 2013 |
| Mauritius | 3,496.0 | 2017 |
| Mongolia | 3,169.0 | 2017 |
| Finland | 3,139.0 | 2016 |
| Slovenia | 2,691.0 | 2016 |
| Sweden | 2,601.0 | 2016 |
| Federated States of Micronesia | 2,303.0 | 2015 |
| Georgia | 2,164.0 | 2017 |
| Antigua and Barbuda | 2,131.0 | 2015 |
| Barbados | 2,126.0 | 2017 |
| Marshall Islands | 1,909.0 | 2016 |
| Qatar | 1,873.0 | 2017 |
| Montenegro | 1,473.0 | 2017 |
| Suriname | 1,363.0 | 2017 |
| Brunei Darussalam | 1,355.0 | 2017 |
| Bahrain | 1,279.0 | 2017 |
| Cyprus | 1,176.0 | 2015 |
| Samoa | 1,154.0 | 2017 |
| Switzerland | 1,146.0 | 2016 |
| Sao Tome and Principe | 1,013.0 | 2017 |
| Canada | 863.0 | 2016 |
| Norway | 848.0 | 2016 |
| Bermuda | 797.0 | 2012 |
| Malta | 585.0 | 2016 |
| Kiribati | 577.0 | 2017 |
| Luxembourg | 436.0 | 2016 |
| Grenada | 411.0 | 2016 |
| Belize | 330.0 | 2017 |
| Lithuania | 273.0 | 2016 |
| Nauru | 263.0 | 2016 |
| Macao | 261.0 | 2017 |
| Maldives | 219.0 | 2017 |
| Saint Vincent and the Grenadines | 209.0 | 2017 |
| Ireland | 163.0 | 2016 |
| Iceland | 151.0 | 2016 |
| Singapore | 138.0 | 2016 |
| Dominica | 117.0 | 2016 |
| San Marino | 117.0 | 2012 |
| Cook Islands | 72.0 | 2015 |
| Fiji | 71.0 | 2016 |
| Tuvalu | 31.0 | 2016 |
| Tokelau | 14.0 | 2016 |
| Liechtenstein | 13.0 | 2016 |
| Tonga | 10.0 | 2015 |
| Palau | 8.0 | 2014 |
Know more:
Related maps: