Why is the ‘International Literacy Day’ celebrated?
 According to UNESCO’s Global Monitoring Report on Education for All, “some 775 million adults lack minimum literacy skills, one in five adults are illiterate and 60.7 million children are out-of-school, while many more drop-out or are irregular to school.”
While nearly every individual learns to communicate verbally, not all are fortunate to get in the formal education system. The idea to eradicate illiteracy and create widespread awareness, an International Day dedicated to literacy was first discussed in 1965, during the ‘World Conference of Ministers of Education’ in Tehran, Iran. The final report of the UNESCO conference stated, “The need for the real emancipation of people and for the increasingly active and productive participation, in the economic, social and political life of human society, of the hundreds of millions of illiterate adults still existing in the world, make it essential to change national education policies.” Hence, on October 26, 1966, the International Literacy Day was designated to September 8th.
Despite the advances made towards eradicating illiteracy, the challenges persist in parallel with the demand for skill development. Hence, the theme for 2018 ILD is: ‘Literacy and Skill Development.’ The ILD will focus and throw light on the integrated approaches that can support both skill development and dissatisfactory literacy levels, to improve quality of work, life and result in a sustainable and equitable society.
The issue is also part of the UN SDG-4 and 2030 Agenda for Sustainable Development. The SDG-4 aims at obtaining quality education, access to inclusive education that can help equip locals with tools required to develop innovative solutions to the prevailing problems. The 2030 Agenda aims at ensuring free primary and secondary education to all girls and boys, access to early childhood development and care and pre-primary education so they are ready for primary education. It also aims at diminishing gender inequalities and providing relevant skill knowledge, expand the number of scholarships, vocational training, communication technology, scientific programs in developed and developing countries.
The UNESCO states the reasons for the lack of quality education to be: the deficit of trained teachers, poor standards of schools and mainly absence of equal opportunity to both rural and urban children. Emphasizing on women and girls, it reports that one-third of the developing countries are not attaining gender parity in primary education. Focusing on Sub-Saharan Africa, it reports that the region accounts for the largest number of out-of-school children in the world. The collective international efforts have not only helped in lessening illiteracy rates from 40% to 22% in Sub-Saharan Africa and from 20% to 6% in Asia, but have helped create a level playing field for all populations, including the remotest areas.
As quoted by Mahatma Gandhi, “Literacy in itself is no education. Literacy is not the end of education or even the beginning. By education I mean an all-round drawing out of the best in the child and man-body, mind and spirit.” Defined on these lines, it is believed literacy is the sole key to the overall development of an individual, which helps them evolve to the best of their potential. It helps attain equality, and break free from the vicious cycle of poverty, further empowering them to live a healthy sustainable life. The ultimate aim of world peace can also be achieved by enhancing literacy levels and by the achievement of other Sustainable Development Goals.
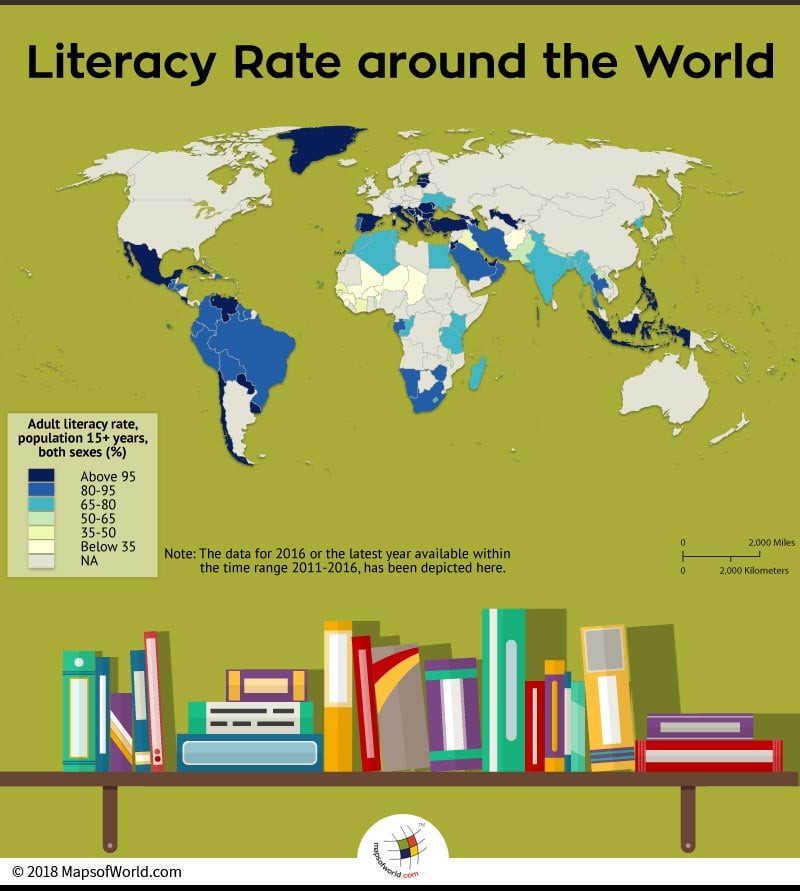
The below lying table depicts the literacy rates around the world:
|
Country |
Adult literacy rate, population 15+ years, both sexes (%) |
Year |
|
Afghanistan |
31.74112 |
2011 |
|
Åland Islands |
97.24697 |
2012 |
|
Albania |
100 |
2016 |
|
Algeria |
66.03011 |
2014 |
|
American Samoa |
98.09 |
2015 |
|
Andorra |
99.74441 |
2011 |
|
Azerbaijan |
99.79006 |
2016 |
|
Bangladesh |
72.75872 |
2016 |
|
Benin |
32.94882 |
2012 |
|
Bhutan |
57.0336 |
2012 |
|
Bolivia |
92.45508 |
2015 |
|
Bosnia and Herzegovina |
96.99177 |
2013 |
|
Brazil |
91.72943 |
2014 |
|
Brunei Darussalam |
96.08556 |
2011 |
|
Bulgaria |
98.35245 |
2011 |
|
Burkina Faso |
34.5994 |
2014 |
|
Burundi |
61.56973 |
2014 |
|
Cabo Verde |
86.79029 |
2015 |
|
Chad |
22.31155 |
2016 |
|
Chile |
96.26706 |
2013 |
|
Macao |
96.53849 |
2016 |
|
Colombia |
94.24505 |
2015 |
|
Comoros |
49.19614 |
2012 |
|
Congo |
79.31117 |
2011 |
|
Costa Rica |
97.40658 |
2011 |
|
Côte d’Ivoire |
43.90842 |
2014 |
|
Croatia |
99.12536 |
2011 |
|
Cuba |
99.75253 |
2012 |
|
Cyprus |
98.67843 |
2011 |
|
North Korea |
77.04268 |
2016 |
|
Dominican Republic |
91.99121 |
2015 |
|
Ecuador |
94.35023 |
2016 |
|
Egypt |
75.06073 |
2013 |
|
El Salvador |
87.96985 |
2015 |
|
Estonia |
99.88579 |
2011 |
|
Gabon |
82.2838 |
2012 |
|
Gambia |
41.95005 |
2013 |
|
Georgia |
99.58619 |
2014 |
|
Greece |
97.12875 |
2011 |
|
Greenland |
100 |
2015 |
|
Guatemala |
81.2859 |
2014 |
|
Guinea |
32.00386 |
2014 |
|
Guinea-Bissau |
45.58116 |
2014 |
|
Guyana |
85.63973 |
2014 |
|
Honduras |
88.98748 |
2016 |
|
India |
69.30256 |
2011 |
|
Indonesia |
95.37697 |
2016 |
|
Iran |
84.70524 |
2014 |
|
Iraq |
43.68328 |
2013 |
|
Italy |
98.84828 |
2011 |
|
Jordan |
97.89032 |
2012 |
|
Kenya |
78.73304 |
2014 |
|
Kuwait |
95.68545 |
2015 |
|
Laos |
58.28794 |
2011 |
|
Latvia |
99.8959 |
2011 |
|
Lesotho |
76.6352 |
2014 |
|
Lithuania |
99.8156 |
2011 |
|
Madagascar |
71.57262 |
2012 |
|
Malawi |
62.14354 |
2015 |
|
Maldives |
98.61012 |
2014 |
|
Mali |
33.06889 |
2015 |
|
Malta |
93.30736 |
2011 |
|
Marshall Islands |
98.26508 |
2011 |
|
Mauritius |
93.30736 |
2015 |
|
Mexico |
98.26508 |
2015 |
|
Montenegro |
98.44221 |
2011 |
|
Morocco |
69.42539 |
2012 |
|
Myanmar |
75.5512 |
2016 |
|
Namibia |
88.27463 |
2011 |
|
Nepal |
59.62725 |
2011 |
|
Niger |
15.4567 |
2012 |
|
Oman |
93.03861 |
2015 |
|
Pakistan |
56.97715 |
2014 |
|
Palau |
96.59374 |
2015 |
|
Palestine |
96.93023 |
2016 |
|
Paraguay |
95.0727 |
2015 |
|
Peru |
94.17367 |
2016 |
|
Philippines |
96.398 |
2013 |
|
Portugal |
94.47705 |
2011 |
|
Qatar |
97.74669 |
2014 |
|
Moldova |
99.13831 |
2012 |
|
Romania |
98.60429 |
2011 |
|
Rwanda |
68.33103 |
2012 |
|
Samoa |
98.97326 |
2011 |
|
Sao Tome and Principe |
90.1431 |
2012 |
|
Saudi Arabia |
94.42634 |
2013 |
|
Senegal |
42.8175 |
2013 |
|
Serbia |
98.84151 |
2016 |
|
Sierra Leone |
32.42617 |
2013 |
|
Singapore |
97.04959 |
2016 |
|
South Africa |
94.36792 |
2015 |
|
Spain |
98.25051 |
2016 |
|
Suriname |
92.86866 |
2012 |
|
Thailand |
92.86831 |
2015 |
|
Togo |
63.74562 |
2015 |
|
Tonga |
99.38553 |
2011 |
|
Tunisia |
79.03643 |
2014 |
|
Turkey |
95.60142 |
2015 |
|
Ukraine |
70.19822 |
2012 |
|
United Arab Emirates |
99.97435 |
2012 |
|
Tanzania |
77.88723 |
2015 |
|
Uruguay |
98.52387 |
2015 |
|
Uzbekistan |
99.98383 |
2015 |
|
Venezuela |
97.12709 |
2016 |
|
Zimbabwe |
88.69342 |
2014 |
Know more:
Related maps: