What are the graduation rates across OECD countries?
A comprehensive understanding of the current graduation patterns, helps experts analyses and better anticipate the flow of new-tertiary educated workers into the labor force. The tertiary education, from an equity perspective have two end-results related to it. These are the labor market outcomes and the social outcomes. A graduation rate represents the estimated percentage of people who will be graduating from a specific level of education (primary, secondary, upper-secondary, non-tertiary and tertiary) over a period of their lifetime. The estimate is based on the year of calculation and the age-specific distribution of graduates. Therefore, any changes in the patterns of systems, such as introduction of new programs and variations, is reflected in the graduation rates across the world.
According to the Organization for Economic Cooperation and Development data, the trends in the tertiary education has shifted tremendously in the member-states. There is marketing of higher education, international mobility of students, higher number of women graduates at tertiary levels and the evolution of the fields of study and research. These depict the change in preferences of the students and researchers these days, whereas also the concerns experienced in the global economy and labor market competitiveness.
The key findings of the report on OECD countries state, that the highest share of graduates across tertiary education programs, complete these in the Business, Administration and Law. Countries like Korea and Portugal have the highest number of tertiary graduates in Engineering, Manufacturing, and Construction. In the cases of Belgium, Norway, Finland and Sweden, the domain of Health and Welfare, reveal the largest share of tertiary graduates. The United States and Saudi Arabia have the most share of tertiary students in Arts and Humanities. These varying numbers in the type of degree pursued, can be explained by the structure of education systems, as well as the kind of institutions offering qualifications in the field of study. In most OECD countries, the percentage of students graduating from STEM subjects (Science, Technology, Engineering, Math) are relatively lower than those graduating from Law, Business and Administration.
Another striking observation made by the OECD data, is that there exists a pattern of gender imbalance. Certain fields of study do not attract female population and does not account for higher percentage of graduate rates. These patterns show the limit from the effect of social perceptions on the choice of occupations and implies translated imbalances in the labor market. This further has economic repercussions, as shown by evidences of GDP gains from more equal participation of male and female workers.
The tertiary education is inclusive of degrees at three levels: bachelor’s degree, master’s degree and short-cycle tertiary diplomas. It is the bachelor’s degree and equivalent degrees that are obtained often by the first-time graduates in the OECD countries. Austria and Russia, have the highest percentage of short-cycle diplomas and master’s degree respectively. These differences are prevalent due to the structure of tertiary systems and the resultant incentive from the obtained degree. The OECD countries have also exhibited concern towards the length of the time taken by the tertiary students, to complete their education. In the backdrop of this, policies have been formulated to foster the student to graduate quickly and transit to the labor force. The average age at which most students graduate is a result of the combination of the average entry age and duration of the program being pursued.
Access to tertiary education is a pointer to the state’s capacity in providing the future labor workforce, with advanced and specialized skill set and knowledge. The incentives from the tertiary education like higher salaries and employment prospects thrusts the students to take up tertiary degrees. Despite the rising costs to an individual, the imparting of tertiary education still remains the prime public enterprise for the member states of the OECD countries.
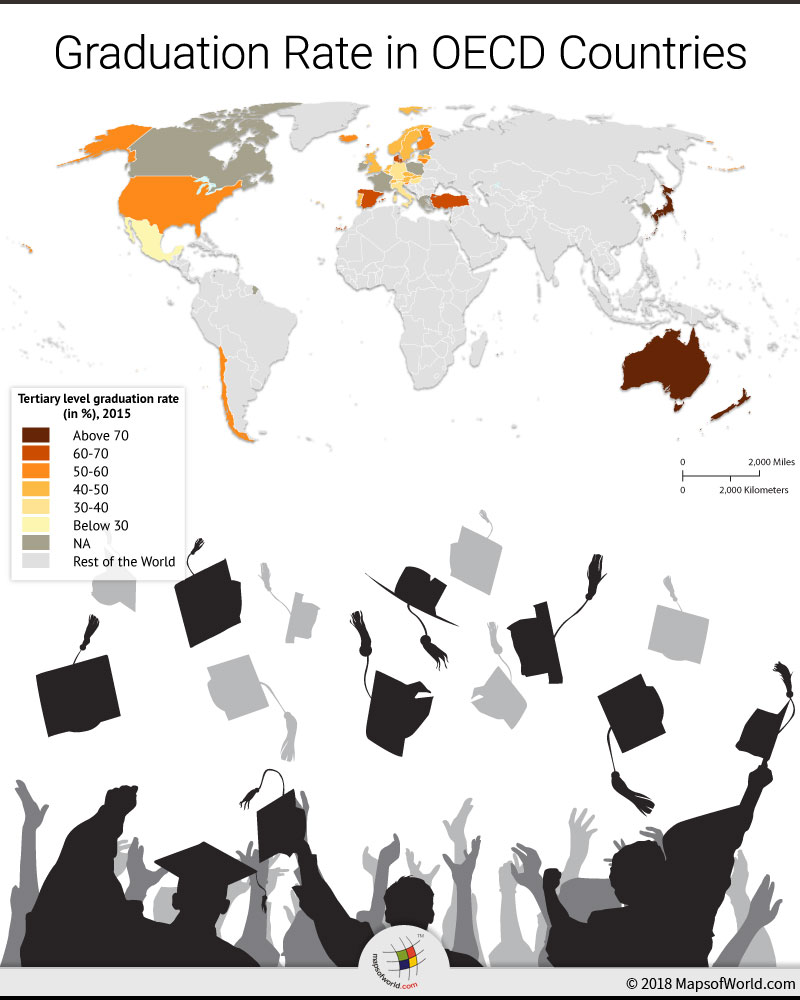
Below given table mentions the graduation rates across OECD countries:
| Location | Percentage,Tertiary Education (2015) |
|---|---|
| Australia | 76.11 |
| New Zealand | 74.88 |
| Japan | 72.12 |
| Denmark | 64.95 |
| Turkey | 60.92 |
| Spain | 60.43 |
| Chile | 58.29 |
| Slovenia | 56.26 |
| United States | 54.91 |
| Lithuania | 54.23 |
| Iceland | 54.12 |
| Finland | 52.6 |
| Austria | 49.26 |
| Netherlands | 48.84 |
| Switzerland | 48.62 |
| Norway | 46.36 |
| Latvia | 44.87 |
| United Kingdom | 44.22 |
| Belgium | 42.61 |
| Slovakia | 41.1 |
| Czech Republic | 41.05 |
| Sweden | 40.62 |
| Portugal | 40.51 |
| Germany | 38.72 |
| Italy | 34.67 |
| Hungary | 32.04 |
| Mexico | 26.08 |
| Luxembourg | 24.48 |
Know more:
- Top 10 countries with lowest levels of primary education
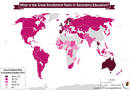
- Gross enrolment ratios in primary education
- Percentage of out-of-school children in primary school age
- Percentage of women teachers in secondary education
Related maps: