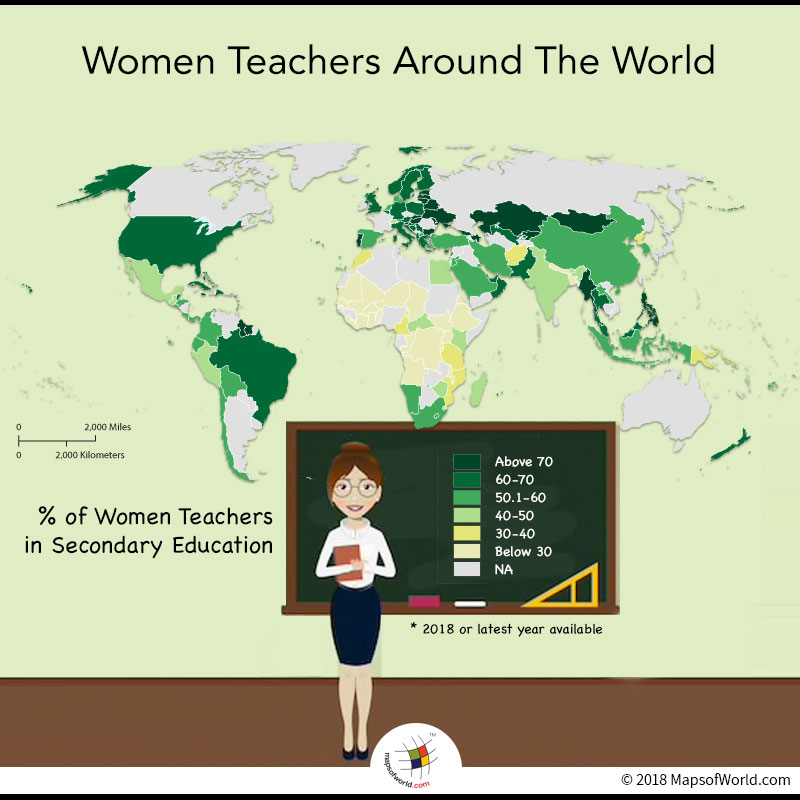
What countries have the most women teachers in secondary education?
Since the early 20th century, education has been considered a basic human right for all children. The Convention on the Rights of the Child, states that primary education should be free and compulsory, while various levels of secondary education, including general and vocational education, should be made available and accessible to each and every child. While the systems in place and the terminologies vary across countries, each nation aims to conform the international norms and work on the guidelines of Sustainable Development Goal 4. Although, there has been an enormous improvement in the percentage rate of education, the Sustainable Development Goal 4 aims at providing quality education by ensuring inclusive and equitable education and promote lifelong learning opportunities.
To prepare the younger generation, for a rapidly changing world, UNESCO places importance on secondary-level education system to be reoriented into a broad range of life-skills learning. The keys skills should be inclusive of generic competencies, non-occupation-specific capabilities that are practical in nature, the ability to learn independently, coordinate in teams, entrepreneurship and civic responsibility. Investment in secondary education also aids in eradication of poverty and social ills that enhance physical and cognitive growth. Social phenomenon like social cohesion as well as equitable distribution of resources, can also be channeled judiciously through attainment of higher levels of education.
Agenda 2030, also places the target of substantially increasing the supply of qualified teachers through international cooperation for teacher training in developing countries and least developed countries. It places qualified teachers at the core of the agenda and states it to be the only means to attaining the target. But the lack of trained and qualified teachers has led to a delay in the global attainment of such a measure. Per UNESCO Institute for Statistics (UIS), the world will soon be facing a shortage of qualified teachers. Acting as a major obstacle, the acute shortage would hinder the global prosperity and advancement towards eradication of illiteracy. The UIS, also reports for a need of 44.4 million secondary school teachers to be recruited by 2030. The scarcity can be witnessed largely in sub-Saharan Africa, with 70% of the countries lacking primary school teachers and 90% of countries facing shortage of secondary school teachers.
In the backdrop of the global absence of quality teachers, the International Task Force on Teachers, also known as The Teachers Task Force, was conceptualized in 2008. Upon agreement in the Oslo Declaration, a voluntary global alliance was formed which brought together government, intergovernmental organizations, non-governmental organizations, international development agencies, civil society organizations, private sector organizations and UN agencies, under one umbrella to address the issue of ‘Teacher Gap’ in various institutions across the world. The task force was also responsible for the implementation and monitoring of the SDG target 4.c, to achieve and pursue the Education 2030 targets and commitments.
Of the total percentage of teachers, women are largely predominant accounting for 85% of the total figure. In secondary school, including both lower secondary and upper secondary levels, there are a total of 3.6 million teachers, of which 64% are females. The dominance of female teachers is the highest in the European Union Member States, reaching almost 90% in Lithuania, Hungary, Slovenia and Italy. The population of women teachers are those women whose professional activity is student instruction, involving the delivery of lessons to students.
Below given table mentions the percentage rate of women teachers in secondary education:
| Country | Percentage of women teachers in secondary education | Year |
|---|---|---|
| Afghanistan | 31.9 | 2017 |
| Albania | 65.92 | 2017 |
| Andorra | 61.9 | 2017 |
| Angola | 29.08 | 2016 |
| Antigua and Barbuda | 72.9 | 2015 |
| Aruba | 59.28 | 2012 |
| Austria | 65.36 | 2016 |
| Azerbaijan | 73.12 | 2017 |
| Bahamas | 70.55 | 2016 |
| Bahrain | 57.18 | 2017 |
| Bangladesh | 22.01 | 2017 |
| Barbados | 65.27 | 2017 |
| Belarus | 79.85 | 2017 |
| Belgium | 63.01 | 2016 |
| Belize | 62.6 | 2016 |
| Benin | 9.95 | 2016 |
| Bermuda | 67.41 | 2017 |
| Bhutan | 41.79 | 2017 |
| Bolivia | 52.32 | 2017 |
| Bosnia and Herzegovina | 61.14 | 2017 |
| Brazil | 64.26 | 2016 |
| British Virgin Islands | 67.18 | 2017 |
| Brunei Darussalam | 68.61 | 2017 |
| Bulgaria | 78.59 | 2016 |
| Burkina Faso | 16.98 | 2017 |
| Burundi | 25.91 | 2017 |
| Cameroon | 34.8 | 2016 |
| Cabo Verde | 46.53 | 2017 |
| Cayman Islands | 67.82 | 2018 |
| Central African Republic | 46.82 | 2017 |
| Chad | 6.38 | 2012 |
| Chile | 59.91 | 2015 |
| China | 53.62 | 2017 |
| Hong Kong | 56.22 | 2017 |
| Macao | 58.41 | 2017 |
| Colombia | 51.08 | 2017 |
| Comoros | 8.81 | 2017 |
| Congo | 9.19 | 2012 |
| Cook Islands | 57.94 | 2016 |
| Costa Rica | 57.43 | 2016 |
| Côte d’Ivoire | 16.22 | 2017 |
| Croatia | 69.79 | 2016 |
| Cuba | 63.7 | 2017 |
| Cyprus | 65.73 | 2016 |
| North Korea | 39.82 | 2018 |
| Democratic Republic of the Congo | 12.46 | 2015 |
| Denmark | 56.36 | 2014 |
| Djibouti | 26.44 | 2017 |
| Dominica | 72.84 | 2016 |
| Dominican Republic | 68.34 | 2015 |
| Ecuador | 57.38 | 2017 |
| Egypt | 46.69 | 2017 |
| El Salvador | 54.57 | 2017 |
| Eritrea | 22.21 | 2017 |
| Estonia | 76.08 | 2016 |
| Eswatini | 49.5 | 2016 |
| Ethiopia | 24.27 | 2012 |
| Fiji | 57.49 | 2012 |
| Finland | 66.57 | 2016 |
| Gambia | 18.62 | 2017 |
| Georgia | 79.83 | 2017 |
| Germany | 62.83 | 2016 |
| Ghana | 24.81 | 2017 |
| Gibraltar | 64.63 | 2017 |
| Greece | 60.42 | 2016 |
| Grenada | 64.89 | 2017 |
| Guatemala | 48.07 | 2016 |
| Guyana | 70.91 | 2012 |
| Honduras | 59.31 | 2018 |
| Hungary | 70.29 | 2017 |
| India | 43.29 | 2017 |
| Indonesia | 54.65 | 2018 |
| Iran | 54.64 | 2016 |
| Italy | 68.61 | 2017 |
| Jamaica | 70.97 | 2018 |
| Jordan | 58.5 | 2018 |
| Kazakhstan | 77.15 | 2018 |
| Kenya | 42.18 | 2015 |
| Kuwait | 55.81 | 2016 |
| Kyrgyzstan | 76.5 | 2016 |
| Laos | 50.87 | 2017 |
| Latvia | 82.62 | 2016 |
| Lebanon | 68.15 | 2017 |
| Lesotho | 55.46 | 2017 |
| Liberia | 4.77 | 2016 |
| Liechtenstein | 53.98 | 2016 |
| Lithuania | 81.5 | 2016 |
| Luxembourg | 53.82 | 2016 |
| Madagascar | 43.12 | 2017 |
| Malawi | 22.94 | 2017 |
| Malaysia | 66.83 | 2017 |
| Mali | 13.54 | 2017 |
| Malta | 65.39 | 2016 |
| Mauritania | 11.38 | 2017 |
| Mauritius | 58.01 | 2017 |
| Mexico | 49.62 | 2012 |
| Monaco | 58.1 | 2017 |
| Mongolia | 72.78 | 2017 |
| Montserrat | 63.89 | 2017 |
| Morocco | 36.26 | 2017 |
| Mozambique | 31.33 | 2017 |
| Myanmar | 86.45 | 2017 |
| Namibia | 53.71 | 2017 |
| Nauru | 50 | 2016 |
| Nepal | 22.95 | 2017 |
| Netherlands | 52.56 | 2017 |
| New Zealand | 63.09 | 2017 |
| Niger | 21.6 | 2018 |
| Niue | 56.52 | 2016 |
| Norway | 62.85 | 2017 |
| Oman | 68.03 | 2018 |
| Pakistan | 61.29 | 2017 |
| Palestine | 52.36 | 2017 |
| Panama | 59.23 | 2016 |
| Papua New Guinea | 38.07 | 2016 |
| Peru | 44.75 | 2017 |
| Philippines | 73.18 | 2016 |
| Poland | 69.35 | 2016 |
| Portugal | 70.27 | 2016 |
| Qatar | 53.32 | 2017 |
| South Korea | 59.49 | 2016 |
| Moldova | 78.85 | 2017 |
| Réunion | 71.34 | 2016 |
| Rwanda | 30.88 | 2017 |
| Saint Kitts and Nevis | 69.45 | 2016 |
| Saint Lucia | 71.96 | 2017 |
| Saint Vincent and the Grenadines | 67.61 | 2017 |
| Samoa | 56.99 | 2016 |
| Sao Tome and Principe | 32.59 | 2016 |
| Saudi Arabia | 50.83 | 2014 |
| Senegal | 26.92 | 2017 |
| Serbia | 65.39 | 2017 |
| Seychelles | 60.97 | 2016 |
| Sierra Leone | 14.49 | 2016 |
| Singapore | 64.94 | 2016 |
| Sint Maarten | 57.82 | 2014 |
| Slovakia | 74.39 | 2015 |
| Slovenia | 74.01 | 2016 |
| Solomon Islands | 32.61 | 2015 |
| South Africa | 57.96 | 2016 |
| South Sudan | 12.71 | 2017 |
| Spain | 57.37 | 2017 |
| Suriname | 73.09 | 2015 |
| Sweden | 64.23 | 2017 |
| Switzerland | 49.25 | 2017 |
| Thailand | 63.72 | 2018 |
| Macedonia | 58.79 | 2016 |
| Tonga | 57.73 | 2016 |
| Turkey | 50.15 | 2016 |
| Turks and Caicos Islands | 60.48 | 2016 |
| Tuvalu | 55.97 | 2016 |
| Uganda | 23.67 | 2015 |
| Ukraine | 80.48 | 2017 |
| United Arab Emirates | 67.94 | 2016 |
| United Kingdom | 62.63 | 2016 |
| Tanzania | 34.84 | 2018 |
| United States of America | 62.01 | 2015 |
| Uzbekistan | 60.16 | 2018 |
| Vanuatu | 41.6 | 2016 |
| Zimbabwe | 45.72 | 2013 |
Know more:
Related maps: