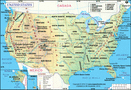
Who are USA’s biggest importers?
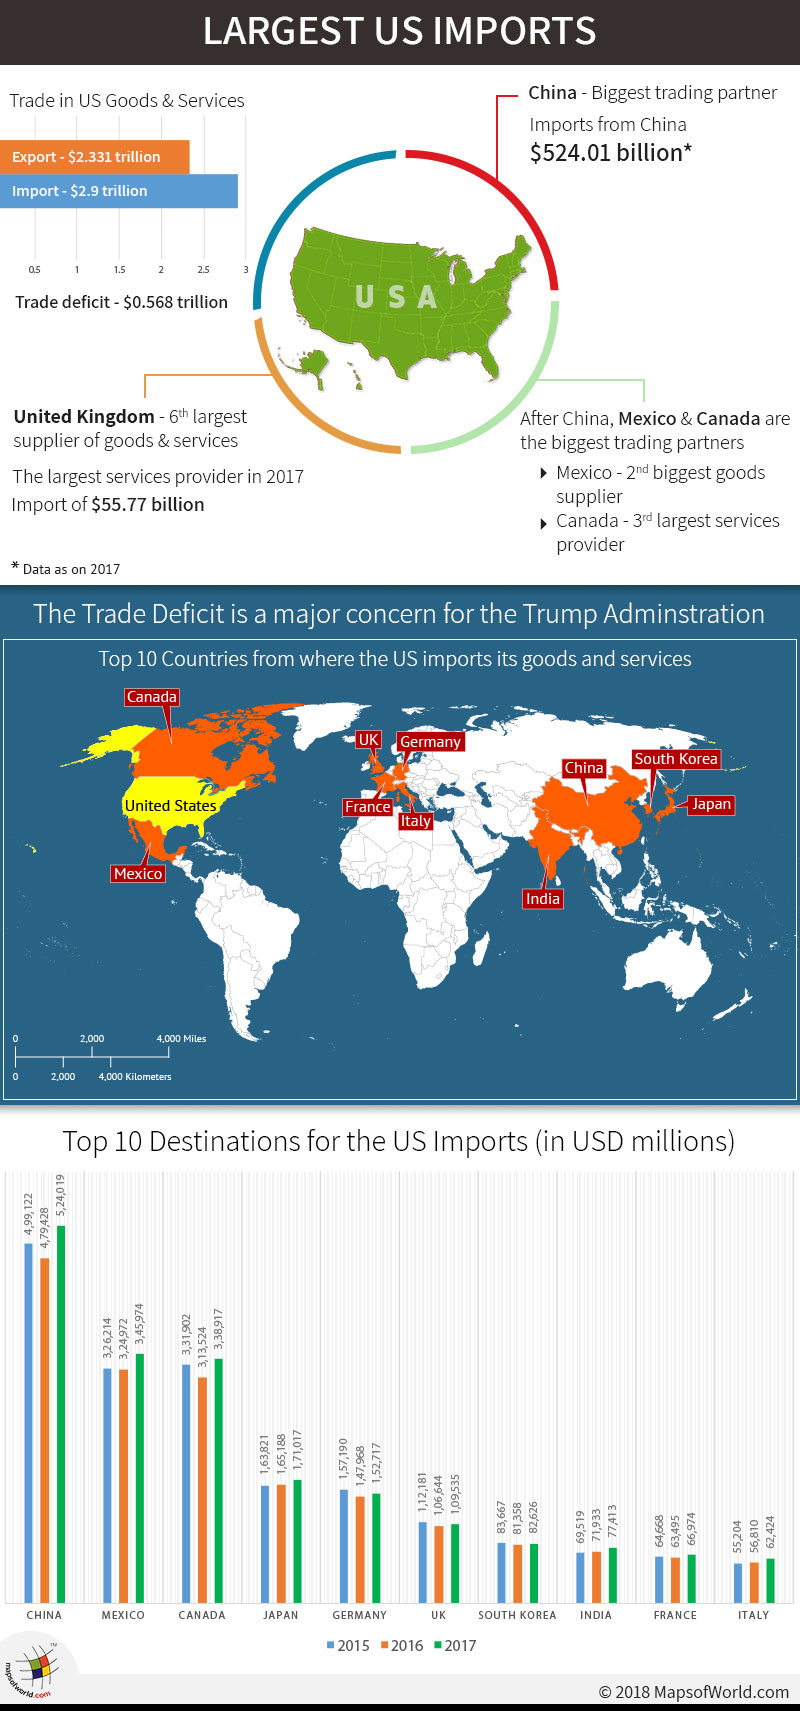 The total trade in US Goods and Services, exports plus imports, was $5.231 trillion in 2017. Total export volume was $2.331 trillion, and US imports was $2.900 trillion. The trade deficit (exports minus imports) in 2017 was; $0.568 trillion.
It is this trade deficit that has been a major cause of concern for the Trump Administration, and in March 2018, announced tariffs of 25% on steel and 10% on aluminum imports.
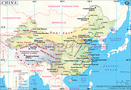
The country most impacted by this decision has been China. China is the largest producer of steel and aluminum in the world and is the largest supplier of goods and services to the United States.
| Top 15 Sources for US Imports (in the US $ million) | |||||||||
| Country | Goods & Services | Goods | Services | ||||||
| 2017 | 2016 | 2015 | 2017 | 2016 | 2015 | 2017 | 2016 | 2015 | |
| Canada | 338,917 | 313,524 | 331,902 | 306,131 | 283,574 | 302,731 | 32,786 | 29,950 | 29,171 |
| Mexico | 345,974 | 324,972 | 326,214 | 319,699 | 300,403 | 303,335 | 26,276 | 24,569 | 22,878 |
| China | 524,019 | 479,428 | 499,122 | 506,469 | 463,288 | 484,058 | 17,550 | 16,139 | 15,064 |
| UK | 109,535 | 106,644 | 112,181 | 53,760 | 54,946 | 58,592 | 55,776 | 51,698 | 53,589 |
| Japan | 171,017 | 165,188 | 163,821 | 138,431 | 134,184 | 134,302 | 32,586 | 31,004 | 29,519 |
| Germany | 152,717 | 147,968 | 157,190 | 118,112 | 114,573 | 125,393 | 34,604 | 33,395 | 31,777 |
| South Korea | 82,626 | 81,358 | 83,667 | 71,621 | 70,384 | 72,430 | 11,005 | 10,974 | 11,237 |
| Brazil | 32,274 | 31,417 | 34,272 | 27,752 | 24,620 | 26,438 | 6,522 | 6,797 | 7,834 |
| France | 66,974 | 63,495 | 64,668 | 49,244 | 47,044 | 48,357 | 17,700 | 16,451 | 16,311 |
| Hong Kong | 17,596 | 16,532 | 16,147 | 7,978 | 7,784 | 7,309 | 9,619 | 8,748 | 8,838 |
| India | 77,413 | 71,933 | 69,519 | 48,736 | 46,125 | 44,909 | 28,677 | 25,808 | 24,610 |
| Singapore | 26,995 | 25,044 | 25,043 | 19,360 | 17,786 | 18,330 | 7,635 | 7,258 | 6,713 |
| Taiwan | 50,671 | 46,979 | 48,649 | 42,538 | 39,248 | 41,004 | 8,132 | 7,732 | 7,645 |
| Italy | 62,424 | 56,810 | 55,204 | 50,179 | 45,471 | 44,418 | 12,245 | 11,339 | 10,786 |
| Saudia Arabia | 20,150 | 18,145 | 23,265 | 18,938 | 16,982 | 22,148 | 1,212 | 1,163 | 1,117 |
In 2017, US imports with the Chinese touched $524.01 billion, close to the total trade deficit the U.S. recorded for 2017, all countries included. In retaliation to U.S. imposition of tariffs aimed mainly at China, China imposed counter tariffs on manufactured goods and commodities from the U.S.
Trade representatives on both sides remain engaged trying to avert a trade war that will affect economies of both countries, and also could drag global trade with it.
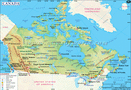
After China, Mexico and Canada respectively, are the biggest trading partners of the United States. Mexico and China have recorded the maximum growth in trade with the U.S. since 2015. The U.S., Mexico, and Canada are signatories to the North American Trade Agreement (NAFTA), and this has boosted trade among the three countries. The biggest beneficiary being Mexico that witnessed several leading American manufacturing companies, including automobiles, to shift their production to Mexico. Goods produced in Mexico were cheaper to the end user (the customers) in the U.S., but also led to a reduction in manufacturing jobs in the United States. While Mexico has been the second biggest goods supplier to the U.S., Canada was the third largest services provider, to the U.S.
The challenge of bringing back jobs to the U.S. along with unfavorable trade terms of NAFTA prompted the Trump administration to push for a renegotiation of the agreement. The uncertainty over NAFTA pending final settlement is likely to reflect on trade figures of all three countries in 2018-19.
The United Kingdom remained the 6th largest supplier of goods and services to the U.S.; it was the largest services provider touching $55.77 billion in 2017. BREXIT is not expected to impact the services business to the U.S. in 2018-19 greatly, but trade between the UK and the EU is expected to get affected.
| Top 15 U.S. Imports in 2017 by Product Category (U.S. $ millions) | |
| Petroleum and Non-Petroleum | 2,266,954 |
| Capital Goods, except Automotive | 702,061 |
| Consumer Goods | 588,681 |
| Industrial Supplies and Materials | 487,199 |
| Automotive Vehicles, Parts and Engines | 354,006 |
| Foods, Feeds, and Beverages | 104,757 |
| Other Goods | 92,088 |
The United States is the world’s biggest importer of goods and services. The country has been facing a widening trade deficit (imports exceeding exports) especially with its biggest trading partner China.
Overall imports have far exceeded exports for the country for a long time. Despite emerging as the world’s second largest producer of petroleum and related products, the U.S. imports in 2017 reached $2.26 trillion (exports were $1.50 trillion). The U.S. has invested heavily in shale gas, but at the time global prices of crude oil dipped to record levels, and production of shale became unviable.
In 2018, with global prices for crude oil rising to $70 per barrel, shale production once again is looking attractive. The U.S. is likely to remain a large producer of shale gas in the future. Exports of shale gas are likely to offset any future reduction in demand for crude oil for the U.S.
Through most of the 20th century, the U.S. economy has grown on the innovation and development of capital goods spurred by domestic and global demand. While the U.S. remains a leader in innovation and development, China is fast catching up in not only low-cost production but is beginning to challenge U.S. lead in innovation and development.
In 2017, the second largest imports after petroleum were capital goods. The U.S. imports recorded $702.06 billion (exports $544.70 billion). Growing imports of petroleum have been another area of concern for the Trump administration. How to reduce the trade deficit?
| Top 15 U.S. Imports in 2017 – Goods (U.S. $ millions) | |
| Passenger Cars, Old & New | 29,831 |
| Crude Oil | 25,377 |
| Pharmaceutical Preparations | 18,817 |
| Other Parts and Accessories of Vehicles | 17,762 |
| Cellphones and other Household Goods | 17,072 |
| Telecommunications Equipment | 12,828 |
| Computers | 10,159 |
| Computer Accessories | 9,335 |
| Industrial Machines, Other | 8,897 |
| Semiconductors | 8,718 |
| Apparel, Textiles, Non-wool or Cotton | 8,495 |
| Electric Apparatus | 8,389 |
| Apparel, Household goods – Cotton | 7,179 |
| Medical Equipment | 6,315 |
| Toys, Games, Sporting Goods | 6,112 |
Passenger cars, both old and new, remain the U.S.’s biggest import of manufactured goods. Automotive accessories too have been major imports for the U.S.
In 2017, the total U.S. imports of passenger cars touched $29.83 billion (exports $9.92 billion). The U.S. faced a trade deficit $19.91 billion on cars.
Petroleum products were the second largest import followed by pharmaceutical preparations. Import value of mobile phones, consumer electronics, and consumer durables was almost the same as automotive parts and accessories, another area where China dominates global production.
| Top U.S. Imports in 2017 – Advanced Technology Products (U.S. $ millions) | |
| Total Imports | 64,450 |
| Information and Communications | 34,276 |
| Life Science | 7,517 |
| Aerospace | 7,012 |
| Electronics | 6,489 |
| Biotechnology | 4,032 |
| Optoelectronics | 2,356 |
| Flexible Manufacturing | 1,999 |
| Advanced Materials | 422 |
| Nuclear Technology | 201 |
| Weapons | 145 |
In advanced technology, IT and related products comprised the largest segment by value recording $34.27 billion in 2017. Overall, besides China, countries like Japan, Taiwan, Singapore, Germany, and France were major beneficiaries of U.S. imports, as suppliers of high technology products. The U.S. remains a large market for aerospace and life sciences related products.
Visit the following to learn more about the USA:
Related Maps: