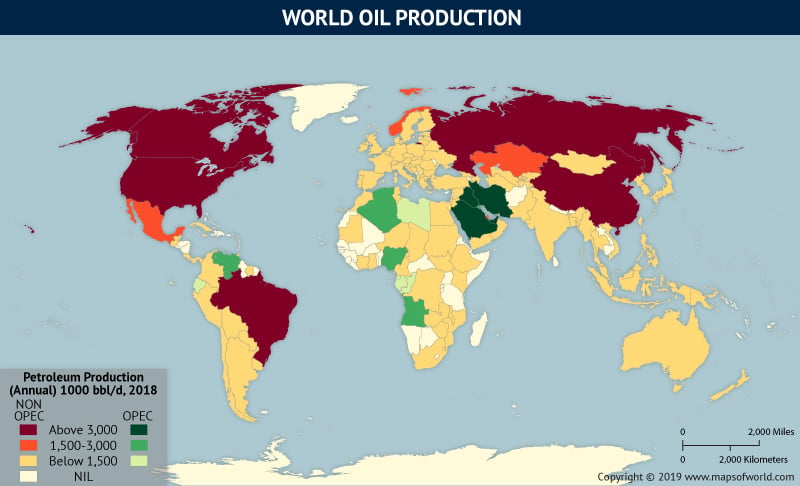
Is Saudi Arabia the Largest Oil Producer in the World?
Oil continues to remain the most in-demand commodity in the world, with demand and prices both climbing steadily since 2016. While demand for oil gets affected by access to other sources of energy such as hydropower, electricity, nuclear, solar and wind, its supply is carefully monitored through the pace of oil extraction.
It began to play an increasingly important role in the world economy in the middle of the 20th-century. Realizing its importance, in 1960, five oil-producing countries – Saudi Arabia, Kuwait, Iran, Iraq, and Venezuela joined hands to establish an intergovernmental organization-Organization of the Petroleum Exporting Countries (OPEC) – with the stated objective of stabilizing international oil production and prices. Many other countries joined the bloc later.
As per OPEC Annual Statistical Bulletin 2019, 79.4% of the world’s proven oil reserves are located in OPEC Member Countries, with the bulk of OPEC oil reserves in the Middle East, amounting to 64.5% of the OPEC total.
In 2008, OPEC Member Saudi Arabia was the largest producer of petroleum in the world, followed by Russia and the United States (US), with the production in the US being almost 50% less than the production in Saudi Arabia.
Though production continued to increase in all the three countries, Saudi Arabia maintained its lead until 2016. In 2017, there was an only marginal difference in the figures of petroleum production for these three countries. However, in 2018, riding on the back of a 17% growth in production, the US surpassed Saudi Arabia to become the world’s largest producer of petroleum. Moreover, the US continues to be one of the most significant consumers of oil in the world.
While non-OPEC countries such as the US and Russia are free to decide their oil production levels, OPEC countries such as Saudi Arabia must abide by the OPEC production targets. So, it is pertinent to note that in December 2018, an agreement was reached by the OPEC Member Countries to extend production cuts. In September 2019, two oil facilities in Saudi Arabia were the target of drone attacks, which significantly curtailed its daily oil output. These factors, as well as an escalation of tensions in the Middle East, are likely to influence oil supply and prices around the globe in the years to come.
World Oil Production (OPEC) 2018
| Rank | Country | Petroleum Production (1000 bbl/day) |
| 1 | Saudi Arabia | 12419 |
| 2 | Iran | 4616 |
| 3 | Iraq | 4468 |
| I | United Arab Emirates | 3791 |
| 5 | Kuwait | 2870 |
| 6 | Nigeria | 2057 |
| 7 | Qatar* | 1943 |
| 8 | Angola | 1655 |
| 9 | Algeria | 1577 |
| 10 | Venezuela | 1527 |
| 11 | Libya | 1074 |
| 12 | Ecuador | 517 |
| 13 | Congo (Brazzaville) | 347 |
| 14 | Gabon | 195 |
| 15 | Equatorial Guinea | 184 |
World Oil Production (Non-OPEC) 2018
| Rank | Country | Petroleum Production (1000 bbl/day) |
| 1 | United States | 17914 |
| 2 | Russia | 11401 |
| 3 | Canada | 5328 |
| I | China | 4810 |
| 5 | Brazil | 3428 |
| 6 | Mexico | 2084 |
| 7 | Kazakhstan | 1959 |
| 8 | Norway | 1864 |
| 9 | United Kingdom | 1163 |
| 10 | India | 1018 |
| 11 | Oman | 988 |
| 12 | Indonesia | 914 |
| 13 | Colombia | 890 |
| 14 | Azerbaijan | 808 |
| 15 | Malaysia | 750 |
| 16 | Argentina | 679 |
| 17 | Egypt | 668 |
| 18 | Thailand | 517 |
| 19 | Australia | 370 |
| 20 | Turkmenistan | 280 |
| 21 | Vietnam | 254 |
| 22 | Germany | 205 |
| 23 | Ghana | 174 |
| 24 | Italy | 157 |
| 25 | Peru | 141 |
| 26 | Chad | 132 |
| 27 | Japan | 127 |
| 28 | South Sudan | 126 |
| 29 | Denmark | 121 |
| 30 | France | 121 |
| 31 | South Korea | 115 |
| 32 | Brunei | 112 |
| 33 | South Africa | 110 |
| 34 | Sudan | 98 |
| 35 | Pakistan | 92 |
| 36 | Romania | 88 |
| 37 | Trinidad & Tobago | 88 |
| 38 | Bolivia | 78 |
| 39 | Turkey | 73 |
| 40 | Netherlands | 70 |
| 41 | Cameroon | 69 |
| 42 | Spain | 68 |
| 43 | Yemen | 61 |
| 44 | Ukraine | 56 |
| 45 | Uzbekistan | 55 |
| 46 | Poland | 55 |
| 47 | Bahrain | 55 |
| 48 | Cote dIvoire (IvoryCoast) | 53 |
| 49 | Cuba | 50 |
| 50 | Papua New Guinea | 45 |
| 51 | Tunisia | 41 |
| 52 | Singapore | 38 |
| 53 | Hungary | 37 |
| 54 | New Zealand | 34 |
| 55 | East Timor | 33 |
| 56 | Belarus | 31 |
| 57 | Taiwan | 30 |
| 58 | Belgium | 29 |
| 59 | Austria | 28 |
| 60 | Syria | 28 |
| 61 | Philippines | 27 |
| 62 | Serbia | 20 |
| 63 | Mongolia | 20 |
| 64 | Czech Republic | 20 |
| 65 | Croatia | 19 |
| 66 | Finland | 18 |
| 67 | Congo (Kinshasa) | 17 |
| 68 | Chile | 16 |
| 69 | Suriname | 16 |
| 70 | Estonia | 16 |
| 71 | Albania | 16 |
| 72 | Greece | 15 |
| 73 | Slovakia | 15 |
| 74 | Sweden | 14 |
| 75 | Guatemala | 14 |
| 76 | Portugal | 13 |
| 77 | Myanmar | 12 |
| 78 | Niger | 9.5 |
| 79 | Lithuania | 9.3 |
| 80 | Israel | 6.4 |
| 81 | Bulgaria | 5.3 |
| 82 | Paraguay | 4.2 |
| 83 | Mauritania | 4 |
| 84 | Bangladesh | 3.1 |
| 85 | Switzerland | 2.3 |
| 86 | Uruguay | 2.2 |
| 87 | Belize | 2 |
| 88 | Costa Rica | 1.6 |
| 89 | Latvia | 1.4 |
| 90 | Barbados | 1 |
| 91 | Kyrgyzstan | 1 |
| 92 | Netherlands Antilles | 0.9 |
| 93 | Kenya | 0.8 |
| 94 | Zimbabwe | 0.8 |
| 95 | Swaziland | 0.8 |
| 96 | Jamaica | 0.7 |
| 97 | Mauritius | 0.5 |
| 98 | Panama | 0.4 |
| 99 | Ireland | 0.4 |
| 100 | Jordan | 0.4 |
| 101 | Georgia | 0.4 |
| 102 | Ethiopia | 0.4 |
| 103 | Mozambique | 0.4 |
| 104 | Slovenia | 0.3 |
| 105 | Bosnia and Herzegovina | 0.2 |
| 106 | Macedonia | 0.2 |
| 107 | Malawi | 0.2 |
| 108 | Tajikistan | 0.2 |
| 109 | Zambia | 0.2 |
| 110 | Morocco | 0.2 |
| 111 | North Korea | 0.1 |
| 112 | Hong Kong | 0.1 |
Source: US Energy Information Administration
Related Map:
