How is Italian Economy?
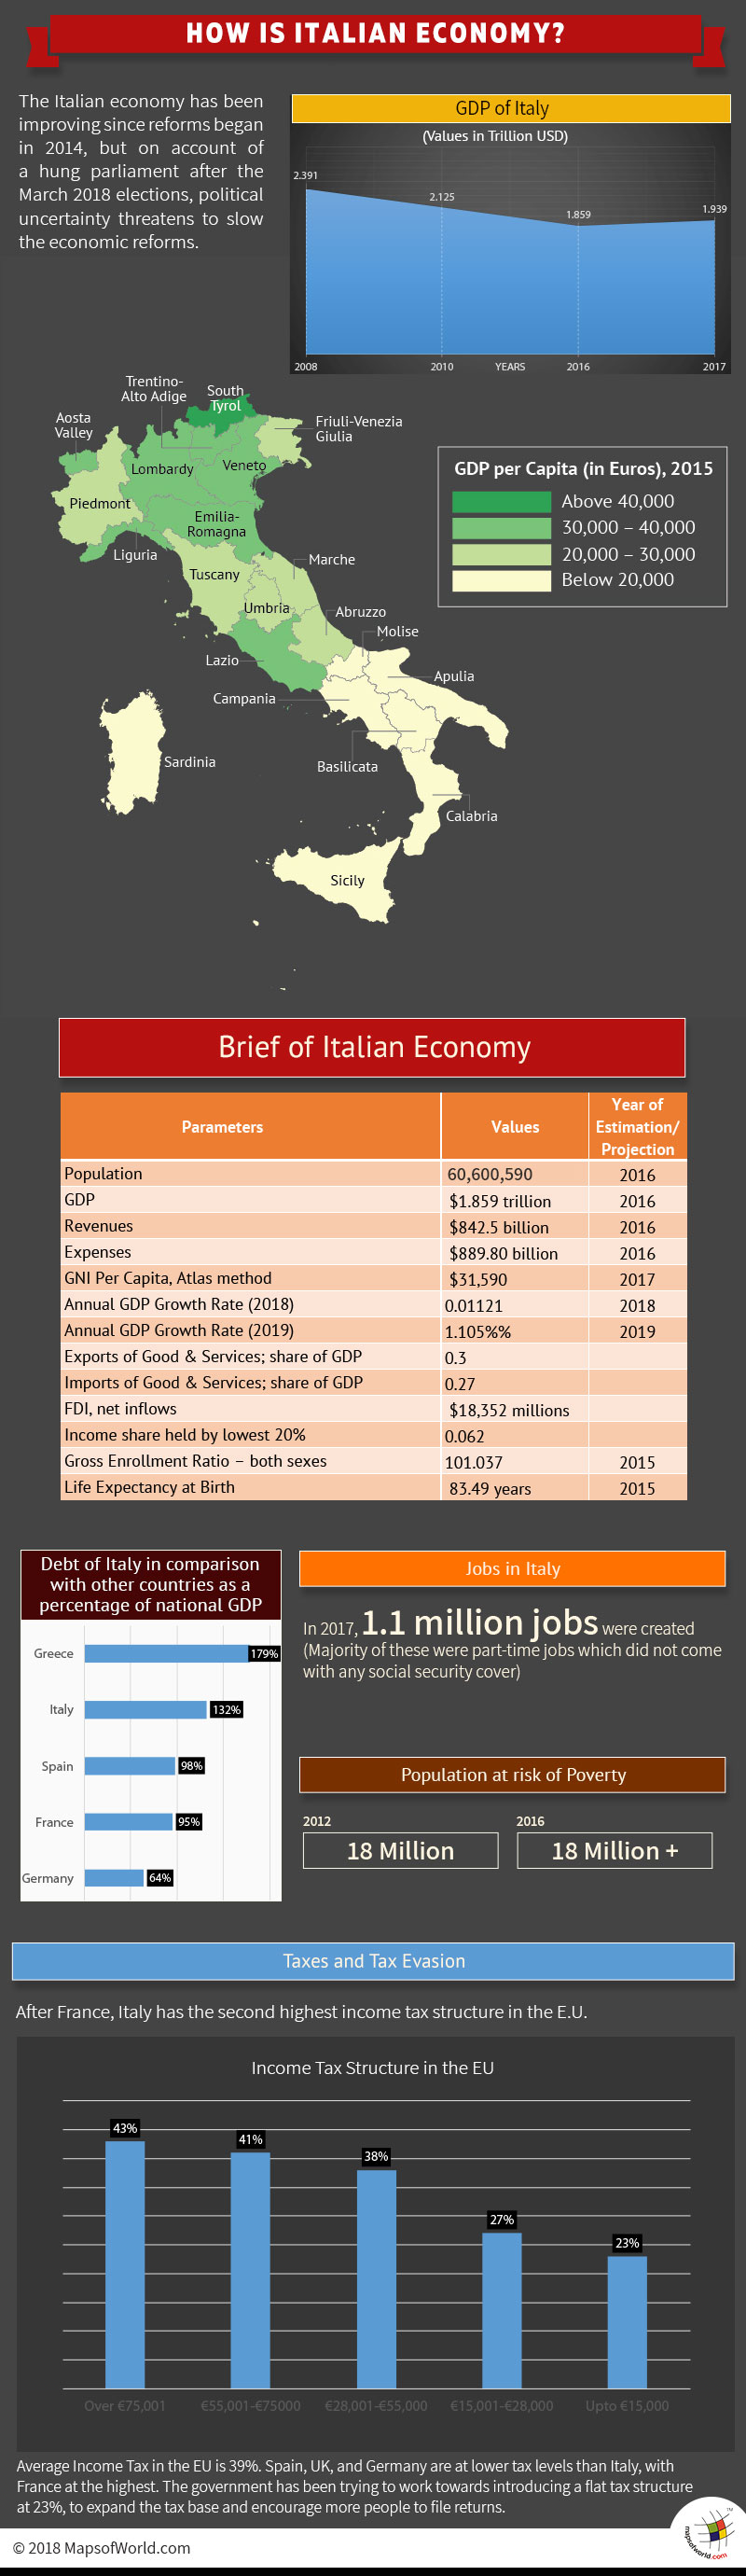
The Italian economy has been improving since reforms began in 2014, and with the global outlook remaining positive for 2018-19, Italy is expected to benefit from global cues. The general elections held in March 2018 have resulted in a hung parliament. With no clear majority for any party, political uncertainty threatens to slow the economic reform agenda of the government and hold the country back from benefiting from the global upswing in business.
The Italian GDP hit its all-time peak in 2008 when it reached $2.391 trillion. In 2010, it dropped to $2.125 trillion, and then further dropped to $1.859 trillion in 2016. While the GDP has come down from the peak levels of 2008 there are signs of the GDP improving with reforms having a positive impact on the overall economy.
Italy – Brief Profile (World Bank)
Population: 60,600,590 (2016)
GDP: $1.859 trillion (2016)
Revenues: $842.5 billion (2016 est)
Expenses: $889.80 billion (2016 est)
GNI Per Capita, Atlas method: $31,590 (2017)
Annual GDP Growth Rate: 1.121% (projected 2018); 1.105% (2019)
Exports of Good & Services; share of GDP: 30%
Imports of Good & Services; share of GDP: 27%
FDI, net inflows: $18,352 millions
Income share held by lowest 20%: 6.2%
Gross Enrollment Ratio – both sexes: 101.037 (2015)
Life Expectancy at Birth: 83.49 years (2015)
Italy is in the process of implementing reforms it began in 2014 to bring the economy out of an extended period of low growth, low productivity. Falling exports have compounded fall in domestic manufacturing thereby adding to the stress the banking system has been facing.
In April 2018, the IMF has warned of an impending global slowdown and an increase in threats to the Global Financial System. Italy remains vulnerable on both counts, as it depends on exports to support fall in domestic consumption.
Through most of 2017, reforms implemented on fiscal, labor, and social security commitments has helped the economy get onto the path of recovery though the country remains below OECD averages on most counts.
Italy has the second highest debt in Europe. Debt as a percentage of national GDP is 132%, after Greece’s 179%. Other E.U. nations’ debt – Germany 64%, France 95%, Spain 98%.
The fiscal policy that was leaning towards expansionary movement is expected to remain close to neutral through 2018. Italy suffers from a parallel economy with tax evasion posing a challenge to the government. Structural reforms are underway to curb tax evasion, increase tax collection and tighten fiscal expenditures that have earlier resulted in a high fiscal deficit.
The GDP growth, however, remains a worry. In 2018, the GDP growth is expected to come down to 1.5% and further dip to 1.3% in 2019. This is a worry but rising domestic consumption along with an increase in global demand is expected to boost manufacturing.
The banking system in Italy had been under considerable stress with several large loans turning into Non-Productive Assets (NPA).
With reforms under implementation, the NPAs have come down, and corporate lending has increased, leading to improvement in manufacturing and job creation.
Jobs
Labor reforms implemented in 2017 is expected to reduce pressure on social costs and expand the jobs market. In 2017, 1.1 million jobs were created. Of these, the majority were part-time jobs which did not come with any social security cover. The number of full-time jobs declined from levels seen in 2016. The southern regions have been hit the most where jobless rates have been as high as 29%. The overall population at risk of poverty has been increasing since 2014, exceeding peak levels seen during 2012 when 18 million faced exposure to the risk. In 2016, the figure crossed 18 million, posing a new challenge to the government
Taxes and tax evasion
The government has been trying to fight the existence of the parallel economy that is extensive with no benefit to the government regarding tax collection. Adding to the problem is Italy’s high personal income tax structure that encourages people to try and evade taxes.
After France, Italy has the second highest income tax structure in the E.U.
Over €75,001: 43%
€55,001-€75000: 41%
€28,001-€55,000: 38%
€15,001-€28,000: 27%
Up to €15,000: 23%
The EU average income tax is 39%. Spain, UK, and Germany are at lower tax levels than Italy, with France at the highest. The government has been trying to work towards introducing a flat tax structure at 23%, to expand the tax base and encourage more people to file returns.
Visit the following to learn more about Italy:
Related Maps: