What is the Gross Enrollment Ratio in secondary education?
Education is the foundation of the overall development of a nation. One educated citizen holds the potential of working equivalent to four times an uneducated citizen can.
Nations around the world have given significant emphasis to the development of education so that it can produce students who can help in the economic growth of their respective nations. Economic growth is measured by multiple parameters of which Research and Development plays an important role. Research and Development promotes innovation and optimum utilization of resources.
But there are many nations where education is still a neglected sector mainly due to years of civil war, economic and political instability, and other factors.
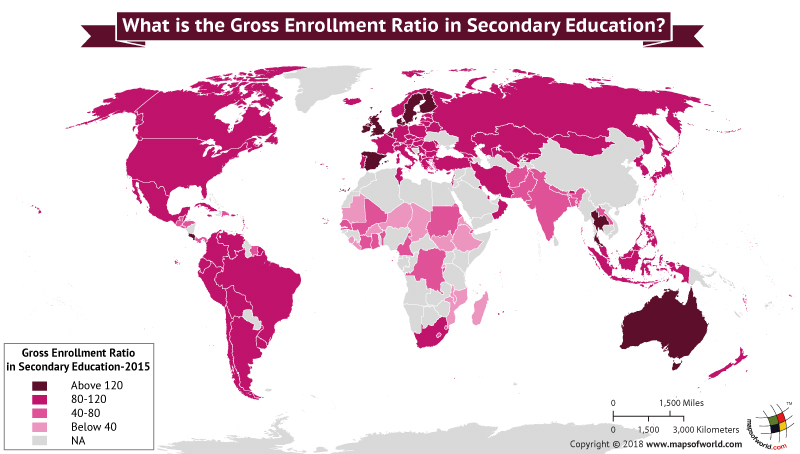
The Gross Enrollment Ratio (GER) is a statistical tool used in the education sector to determine the number of students enrolled at all levels of education in various countries. It is regardless of age, expressed as a percentage of the population of official secondary education age.
Here is a table representing the World Bank 2015 report on Gross Enrollment Ratio in secondary education.
| Country Name | GER (%) 2015 in Sec. education |
|---|---|
| Belgium | 163.9 |
| Australia | 158.1 |
| Finland | 150 |
| Sweden | 140.4 |
| Netherlands | 133.5 |
| Denmark | 130.3 |
| Spain | 129.5 |
| Ireland | 127.2 |
| The United Kingdom | 125.5 |
| Costa Rica | 123.1 |
| Thailand | 120.6 |
| Iceland | 119.1 |
| Portugal | 118.2 |
| Liechtenstein | 116.1 |
| New Zealand | 114.7 |
| Norway | 113 |
| Latvia | 112.2 |
| Uruguay | 111.6 |
| France | 111.1 |
| Canada | 110.9 |
| Estonia | 110.9 |
| Slovenia | 109.8 |
| Kazakhstan | 109.4 |
| Barbados | 108.5 |
| Ecuador | 107.7 |
| Argentina | 107.1 |
| Poland | 106.6 |
| St. Vincent and the Grenadines | 106.4 |
| The Czech Republic | 105 |
| Belarus | 104.8 |
| Russia | 104.4 |
| Lithuania | 103.6 |
| Oman | 103.3 |
| Italy | 103.2 |
| Turkey | 103.1 |
| Hungary | 103 |
| South Africa | 102.8 |
| Israel | 102.5 |
| Bulgaria | 102.3 |
| Japan | 102.1 |
| Bahrain | 102.1 |
| Luxembourg | 102 |
| Georgia | 101.8 |
| Hong Kong | 101.4 |
| Switzerland | 101.2 |
| Germany | 101.1 |
| Dominica | 100.5 |
| Cuba | 100.4 |
| Korea, South | 100.2 |
| Austria | 100.1 |
| Chile | 99.9 |
| Cyprus | 99.8 |
| Brazil | 99.7 |
| Greece | 99.3 |
| Grenada | 99.2 |
| British Virgin Islands | 98.7 |
| Croatia | 98.2 |
| Colombia | 98.1 |
| Kuwait | 97.5 |
| Mauritius | 97.4 |
| United States of America | 97.2 |
| Serbia | 96.7 |
| Tuvalu | 96 |
| Brunei | 95.8 |
| Albania | 95.8 |
| Peru | 95.7 |
| Mexico | 95.3 |
| Macao | 94.9 |
| Malta | 94.8 |
| Antigua and Barbuda | 93.6 |
| Kyrgyzstan | 93.3 |
| Korea, North | 93 |
| Montenegro | 92.7 |
| Seychelles | 92.3 |
| Uzbekistan | 91.6 |
| Mongolia | 91.4 |
| Qatar | 91.2 |
| Slovakia | 91 |
| Romania | 90.9 |
| Venezuela | 89.4 |
| Iran | 88.9 |
| Philippines | 88.3 |
| St. Lucia | 88.2 |
| Tunisia | 88.2 |
| Indonesia | 87.3 |
| Puerto Rico | 86.5 |
| Bolivia | 86.4 |
| Moldova | 86.1 |
| Armenia | 86 |
| Cabo Verde | 85.3 |
| Malaysia | 85 |
| Samoa | 84.9 |
| Palestine | 83.2 |
| Bhutan | 82.9 |
| Sao Tome and Principe | 82 |
| Macedonia | 81.9 |
| Belize | 80.8 |
| Jamaica | 80.6 |
| Suriname | 78.5 |
| The Dominican Republic | 77.8 |
| Marshall Islands | 76.6 |
| Panama | 75.8 |
| El Salvador | 75.7 |
| India | 74 |
| Bermuda | 71.5 |
| Timor-Leste | 68 |
| Nepal | 67.1 |
| Swaziland | 67 |
| Guatemala | 64.5 |
| Laos | 63.6 |
| Honduras | 63.5 |
| Bangladesh | 63.4 |
| Lebanon | 61.3 |
| Cameroon | 60.7 |
| Ghana | 59.4 |
| Benin | 58.8 |
| Vanuatu | 54.8 |
| Afghanistan | 53.9 |
| Lesotho | 53.5 |
| Senegal | 50.2 |
| Democratic Republic of the Congo | 46.2 |
| Sudan | 45.8 |
| Burundi | 45.1 |
| Pakistan | 44.4 |
| Djibouti | 43.3 |
| Cote d’Ivoire | 43.3 |
| Mali | 41.7 |
| Malawi | 38.8 |
| Madagascar | 38.5 |
| Sierra Leone | 38.2 |
| Liberia | 37.4 |
| Rwanda | 37.4 |
| Ethiopia | 35.1 |
| Burkina Faso | 33.7 |
| Eritrea | 33.1 |
| Mozambique | 32.9 |
| Mauritania | 30.3 |
| Chad | 22.5 |
| Niger | 20.6 |
| South Sudan | 9.9 |
Data Source: World Bank
Know more:
- What are the Ten Most Influential Countries?
- What country has the Most Public Libraries in the World?
Related Maps: