What is the average monthly net wage in the US & Canada?
The average monthly net wage (after tax) of US is $2,686.12, and Canada is USD $2,394.01.
The average monthly wage in the USA is $4,417, and Canada is USD $3,072.
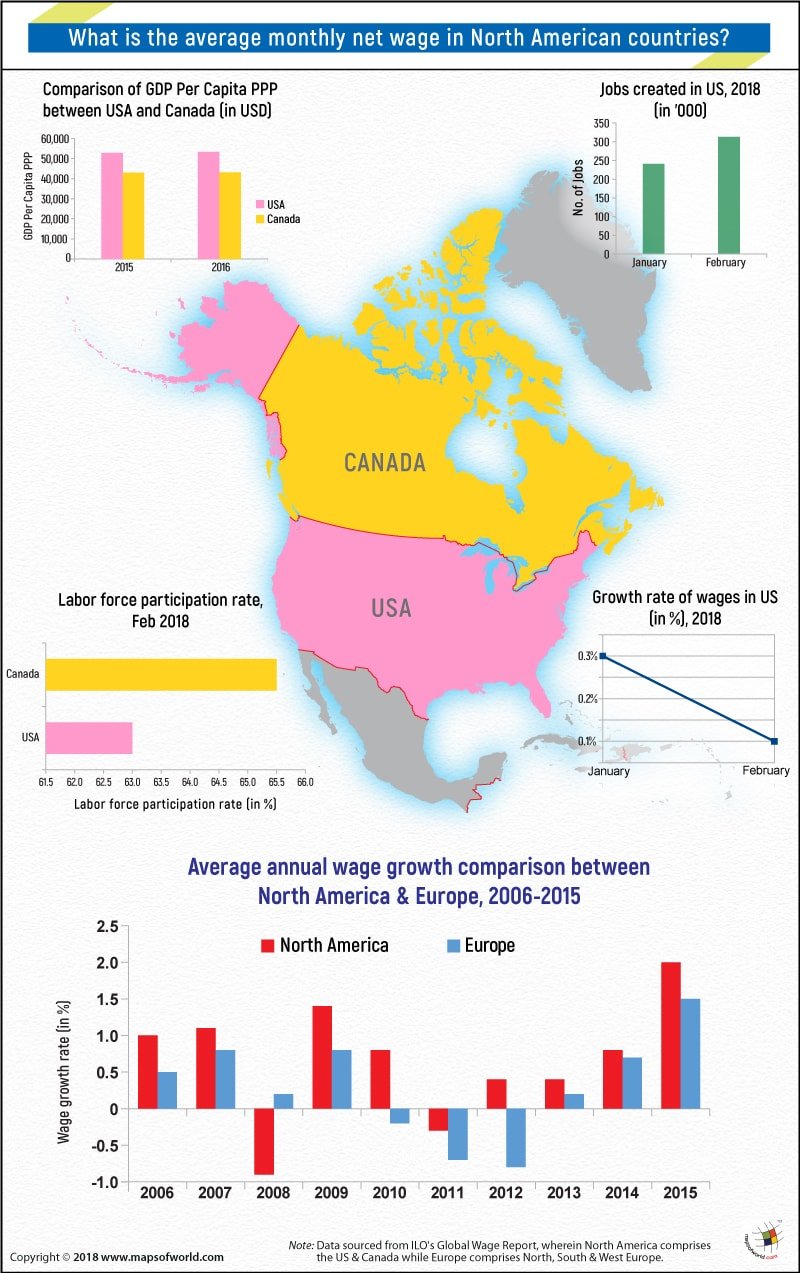
After almost a decade of weak growth, the wages in North America in 2015 accelerated on the back of 2.2% growth in real wages in the US. Wage growth was at its slowest growth in the previous decade starting 1998 and only began picking up the pace from after 2015.
Between 2006 to 2015, only 2008 saw a negative growth rate in wages at -0.9% and in 2011 at -0.3%. The best growth rate seen in 2015 was 2%, and the next best rate was 1.4% in 2009.
For most of Europe (North, South, and West), the best growth rate recorded in the same period was 1.5%in 2015, and the next best was 0.8% in 2007 and 2009. The slowest growth rate recorded was -0.8% in 2012.
The wages growth rate in North America influences the rate of job creation in the US. 2018 started off well with an average of 241,000 jobs being created each month since January, a higher rate of employment not seen for a long time.
In February, the US economy added 313,000 new jobs, but the problem has been the slow growth rate in wages, which has not kept pace with the expansion of the job market. In January, it grew 0.3% but dropped to 0.1% in February.
The reason for this sluggish growth rate is that jobs are being created in the lower wage band rather than in higher wage sector. Higher paying manufacturing jobs market has not opened up at the rate, holding back the average wage growth rate.
With over 5 million manufacturing jobs lost in the previous decade in the US, the slow rate of recovery is impacting the expansion in purchasing power of the average consumer. This, in turn, is impacting the wages growth rate in Canada.
In 2016, Canada’s GDP per Capita was USD 50,232, marginally higher than USD 50,110 in 2015. Compare this with GDP per Capita of USA at USD 52,195 for 2016 and USD 51,772 for 2015.
Canada’s unemployment rate in Feb 2018 stood at 5.8 %, compared to 5.9%in February 2017. Although the February rate is higher than USA’s 4.1% for the same period, it was the lowest recorded for almost four decades.
In December 2017, Canada added 79,000 jobs, but 54,900 were part-time, and of these, the majority were in the lower range. Full-time jobs added only equaled 23,700. All of these together have an impact on the average net monthly wage in Canada and the USA. Regarding the labor force participation rate, Canada fared better at 65.5% as on Feb 2018, as compared to USA’s 63%.
Comparison of GDP Per Capita PPP between USA and Canada (in USD)
USA
- 2015: 52,790
- 2016: 53,272
Canada
- 2015: 42,983
- 2016: 43,088
Visit the following to learn more about North America:
Related Maps: