764
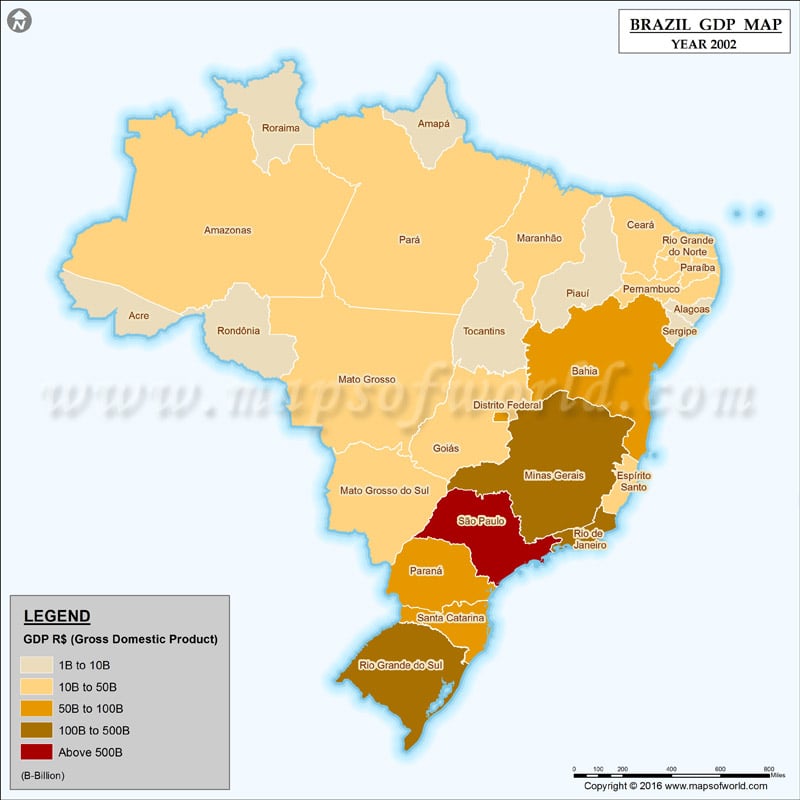
Gross value added at basic prices by economic activities of Major Regions and Federation Units – 2002-2012 |
|---|
| Major Regions and Federative Units | 2002 | 2003 | 2004 | 2005 | 2006 | 2007 | 2008 | 2009 | 2010 | 2011 | 2012 |
|---|---|---|---|---|---|---|---|---|---|---|---|
| Brasil | 1,273,129 | 1,470,614 | 1,666,258 | 1,842,253 | 2,034,421 | 2,287,858 | 2,580,449 | 2,794,379 | 3,227,181 | 3,530,871 | 3,725,069 |
| Norte | 61,317 | 71,833 | 84,640 | 93,888 | 105,698 | 117,541 | 135,602 | 144,471 | 178,865 | 198,658 | 202,982 |
| Rondônia | 6,971 | 8,678 | 10,010 | 11,459 | 11,548 | 13,299 | 15,917 | 18,069 | 20,817 | 24,673 | 26,024 |
| Acre | 2,649 | 3,041 | 3,626 | 4,108 | 4,388 | 5,276 | 6,193 | 6,797 | 7,743 | 8,051 | 8,681 |
| Amazonas | 18,172 | 20,981 | 24,917 | 27,844 | 32,976 | 34,974 | 37,998 | 41,719 | 49,985 | 53,898 | 52,577 |
| Roraima | 2,147 | 2,557 | 2,613 | 2,946 | 3,382 | 3,828 | 4,503 | 5,153 | 5,818 | 6,408 | 6,714 |
| Pará | 23,199 | 26,796 | 32,326 | 35,263 | 39,828 | 44,460 | 52,777 | 52,466 | 71,043 | 80,822 | 81,724 |
| Amapá | 3,100 | 3,222 | 3,595 | 4,058 | 4,898 | 5,621 | 6,318 | 6,899 | 7,677 | 8,350 | 9,586 |
| Tocantins | 5,081 | 6,558 | 7,553 | 8,210 | 8,677 | 10,082 | 11,896 | 13,368 | 15,780 | 16,456 | 17,676 |
| Nordeste | 168,717 | 191,649 | 216,924 | 245,785 | 271,351 | 304,876 | 348,334 | 387,317 | 446,063 | 486,899 | 517,233 |
| Maranhão | 14,146 | 17,070 | 19,692 | 22,870 | 25,705 | 28,321 | 34,619 | 36,067 | 40,454 | 46,545 | 51,993 |
| Piauí | 6,646 | 7,906 | 8,827 | 9,965 | 11,385 | 12,603 | 14,957 | 17,006 | 19,611 | 21,975 | 22,687 |
| Ceará | 25,391 | 28,668 | 32,415 | 36,236 | 40,590 | 44,169 | 52,733 | 58,012 | 68,264 | 77,476 | 78,109 |
| Rio Grande do Norte | 10,776 | 11,907 | 13,708 | 15,756 | 18,040 | 20,238 | 22,405 | 24,700 | 28,543 | 31,880 | 34,688 |
| Paraíba | 11,127 | 12,703 | 13,460 | 15,062 | 17,875 | 19,935 | 23,091 | 25,926 | 28,561 | 31,718 | 34,342 |
| Pernambuco | 30,605 | 34,270 | 38,154 | 42,936 | 47,651 | 53,313 | 60,110 | 67,326 | 81,629 | 88,506 | 99,275 |
| Alagoas | 8,911 | 10,141 | 11,653 | 12,751 | 14,112 | 15,968 | 17,443 | 19,084 | 21,932 | 25,661 | 26,374 |
| Sergipe | 8,434 | 9,732 | 10,953 | 11,995 | 13,490 | 15,168 | 17,592 | 17,780 | 21,377 | 23,413 | 24,532 |
| Bahia | 52,681 | 59,252 | 68,062 | 78,215 | 82,503 | 95,161 | 105,384 | 121,416 | 135,693 | 139,724 | 145,233 |
| Sudeste | 709,558 | 807,438 | 911,979 | 1,025,563 | 1,138,644 | 1,269,591 | 1,417,561 | 1,519,448 | 1,756,475 | 1,922,243 | 2,023,839 |
| Minas Gerais | 110,946 | 129,746 | 155,934 | 167,301 | 187,588 | 210,229 | 245,323 | 252,340 | 307,865 | 339,423 | 351,903 |
| Espírito Santo | 22,185 | 25,384 | 32,487 | 37,853 | 42,645 | 48,444 | 55,508 | 54,182 | 67,507 | 78,921 | 87,640 |
| Rio de Janeiro | 147,287 | 163,298 | 185,629 | 208,508 | 233,778 | 250,856 | 290,150 | 301,539 | 344,405 | 395,073 | 429,123 |
| São Paulo | 429,140 | 489,010 | 537,930 | 611,901 | 674,633 | 760,062 | 826,580 | 911,386 | 1,036,698 | 1,108,826 | 1,155,173 |
| Sul | 218,225 | 264,232 | 295,859 | 309,203 | 336,679 | 386,711 | 433,873 | 468,604 | 536,929 | 575,335 | 604,795 |
| Paraná | 77,220 | 96,728 | 107,659 | 110,879 | 119,521 | 141,662 | 154,631 | 166,369 | 187,263 | 204,265 | 216,777 |
| Santa Catarina | 48,995 | 58,765 | 68,497 | 74,582 | 81,546 | 91,316 | 106,991 | 113,332 | 130,618 | 143,352 | 149,779 |
| Rio Grande do Sul | 92,011 | 108,739 | 119,703 | 123,742 | 135,612 | 153,733 | 172,252 | 188,903 | 219,048 | 227,717 | 238,240 |
| Centro-Oeste | 115,311 | 135,462 | 156,856 | 167,815 | 182,049 | 209,138 | 245,079 | 274,539 | 308,849 | 347,737 | 376,221 |
| Mato Grosso do Sul | 13,403 | 16,885 | 18,213 | 18,432 | 20,702 | 23,925 | 27,888 | 31,258 | 37,821 | 42,737 | 47,103 |
| Mato Grosso | 18,577 | 24,761 | 32,992 | 33,392 | 30,967 | 37,908 | 47,591 | 51,279 | 53,025 | 64,246 | 72,319 |
| Goiás | 33,131 | 37,580 | 42,688 | 44,751 | 50,310 | 57,507 | 65,850 | 75,552 | 84,768 | 96,285 | 107,940 |
| Distrito Federal | 50,200 | 56,236 | 62,963 | 71,240 | 80,070 | 89,799 | 103,749 | 116,450 | 133,235 | 144,469 | 148,859 |
previous post
