WORLD MAP
Why do we need to look at a World Map?
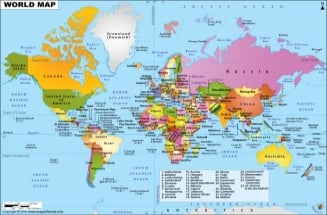
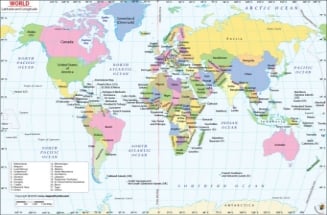
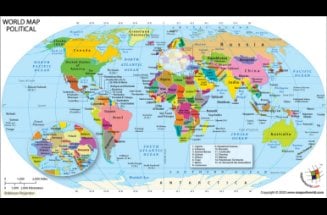
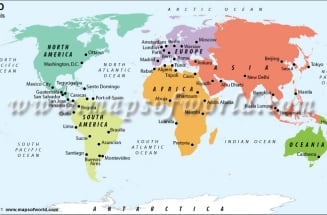
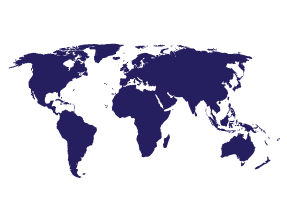
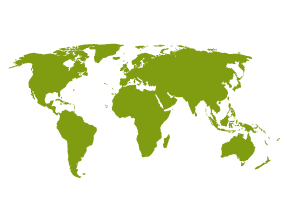
We need a world map to act as a reference point to all that what is happening in various parts of the world. A world Map works best with the data set it is mashed-up with. A World Map is a representation of all continents and countries in the world. Looking at a world map tells us the depth and shallowness of our knowledge about our world, at the same time.

Buy World Maps


The 206 listed states of the United Nations depicted on the world map are divided into three categories: 193 member states, 2 observer states, and 11 other states. The 191 sovereign states, are the countries whose sovereignty is official, and no disputes linger. There are 15 states under the category of “sovereignty dispute”. There are 5 member states, 1 observer state and 9 other states. This image of map of the world is current as on date January 01, 2019.
- What is the Capital of Alabama
- How Old is Japan
- Tallest Buildings in the US
- Is Greenland a Country
- Is Monaco Part of France
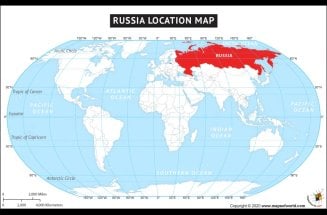
- What Continent is Russia in
- Is Washington DC a State?
- What is the Capital of Cuba


ABOUT US
MapsOfWorld.com (MOW) is a multilingual website centered around thematic maps. The site has over 150,000 maps, facts, graphics, infographics, videos, and photographs. The platform is available in English, Spanish, German, French, Chinese, Portuguese, Arabic, Bengali, and Hindi.