logo

Scottish Referendum Live Results
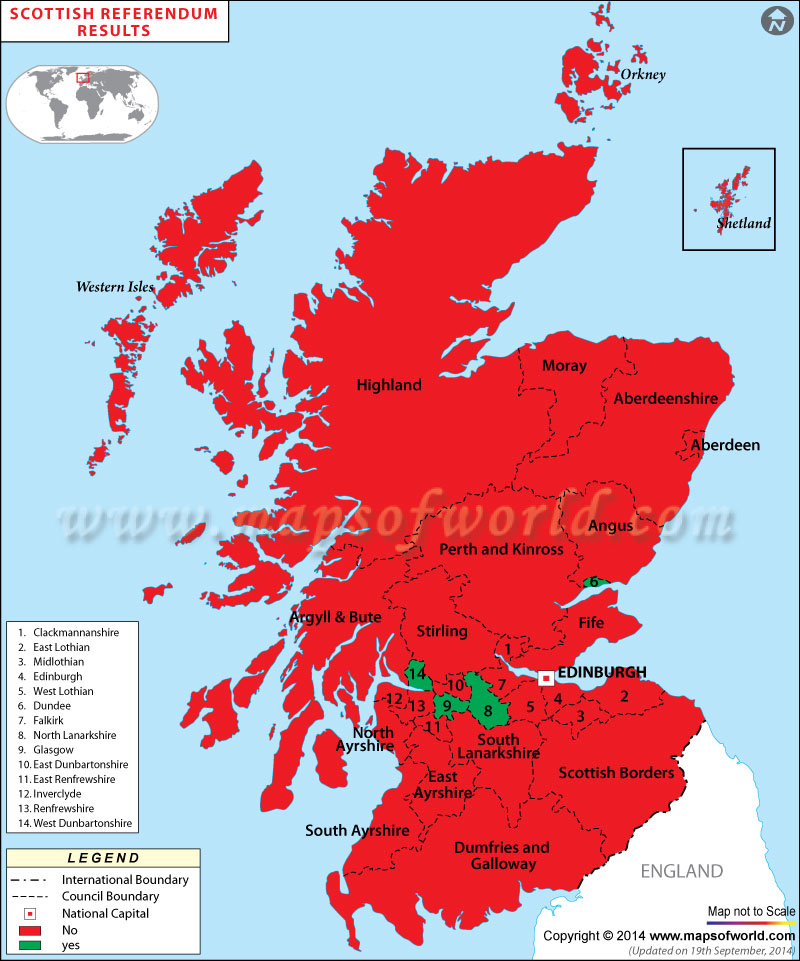
Scottish Referendum Live Results
Description :      Disclaimer
×

Disclaimer  :  All efforts have been made to make this image accurate. However MapSherpa, Inc, its directors and employees do not own any responsibility for the correctness or authenticity of the same.


Scottish Independence Referendum Results
COUNCILELECTORATEYESNO
Aberdeen City175,74541.39%58.61%
Aberdeenshire206,48639.64%60.36%
Angus93,55143.68%56.32%
Argyll & Bute72,00241.48%58.52%
Clackmannanshire39,97246.20%53.80%
Comhairle nan Eilean Siar22,90846.58%53.42%
Dumfries & Galloway122,03634.33%65.67%
Dundee City118,72957.35%42.65%
East Ayrshire99,66447.22%52.78%
East Dunbartonshire86,83638.80%61.20%
East Lothian81,94538.28%61.72%
East Renfrewshire72,98136.81%63.19%
Edinburgh378,01238.90%61.10%
Falkirk122,45746.53%53.47%
Fife302,16544.95%55.05%
Glasgow486,21953.49%46.51%
Highland190,778  
Inverclyde62,48149.92%50.08%
Midlothian69,61743.70%56.30%
Moray75,17042.44%57.56%
North Ayrshire113,92348.99%51.01%
North Lanarkshire268,70451.07%48.93%
Orkney Islands17,80632.80%67.20%
Perth & Kinross120,01539.81%60.19%
Renfrewshire134,73547.19%52.81%
Scottish Borders95,53333.44%66.56%
Shetland Islands18,51636.29%63.71%
South Ayrshire94,88142.13%57.87%
South Lanarkshire261,15745.33%54.67%
Stirling69,03340.23%59.77%
West Dunbartonshire71,10953.96%46.04%
West Lothian138,22644.82%55.18%

Last Updated on: October 26th, 2017