In What Countries are Classrooms at the Primary Level Less Crowded?
Proper schools, sound infrastructure and affordable fees are just some prerequisites for a robust educational system. However, the educational system in some nations around the world has not been able to meet the required standards due to factors such as unqualified teachers, lack of proper government funding and overcrowded classrooms — where the ratio of the teacher per student is unbalanced.
Fortunately, there are nations that are not suffering from these drawbacks, and have been able to evolve a sound educational system, providing high quality of education to the students at the primary level. If a teachers have lesser number of students in classrooms to attend to, they can provide the required attention to each student. They will be able to interact better with the students and help them with their troubled subjects. A low ratio is a major selling point for parents when they select schools. In the United States of America, some states have strict laws regarding the maximum student-teacher ratio, especially for kindergarten. A primary education is a foundation of students and the better its quality, the more secure is the future of children.
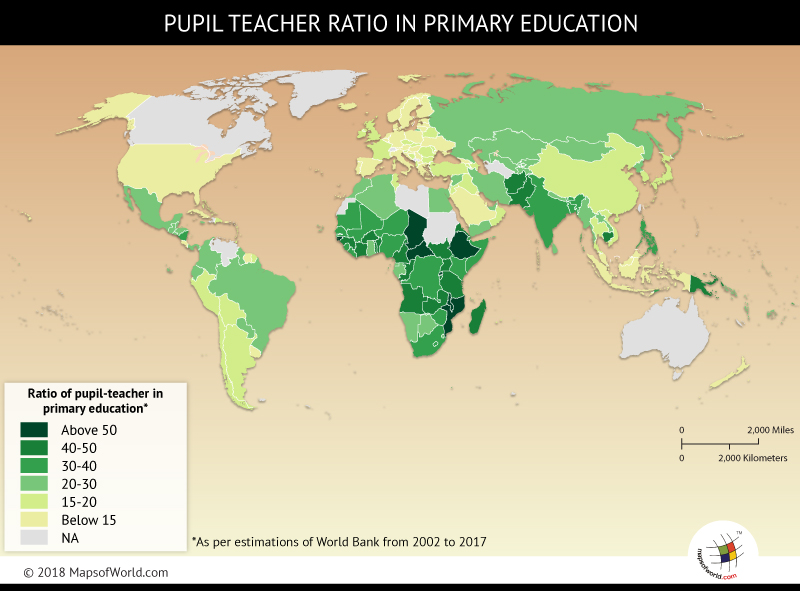
According to a World Bank reports, European microstate San Marino witnesses less crowded classrooms at the primary level, with the student-teacher ratio standing at six students per teacher. This balanced ratio has enabled teachers to give equal emphasis to each student. The figures in Kuwait, Georgia, Luxembourg and Liechtenstein are also praiseworthy, as the average ratio is not more than 9 students per teacher. It is one of the reasons why these nations also have good literacy levels.
In the United States, the average ratio is 15 students per teacher, and the United Kingdom has ratio of 17 students per teacher.
The countries lying at the extreme end were some African nations such as Central African Republic, Malawi and Rwanda. Here the classrooms are quite crowded, with the ratio more than 55. In fact, in Central African Republic, on an average a teacher is appointed with 83 students in a classroom. The statistics here are shocking, and a deeper attention needs to be paid towards the education system. But, the countries are already struggling with major issue revolving around internal conflicts and corruption.
Here is a table mentioning the average pupil-teacher ratio in 191 countries at the primary age level:
| Country | Pupil-teacher ratio, primary | Year |
|---|---|---|
| San Marino | 6.27 | 2012 |
| Liechtenstein | 7.68 | 2016 |
| Luxembourg | 8.46 | 2015 |
| Georgia | 8.83 | 2016 |
| Kuwait | 8.86 | 2016 |
| Norway | 8.87 | 2015 |
| Cuba | 8.90 | 2015 |
| Greece | 9.64 | 2015 |
| Andorra | 10.07 | 2016 |
| Iceland | 10.14 | 2015 |
| Brunei Darussalam | 10.20 | 2016 |
| Maldives | 10.30 | 2016 |
| Austria | 10.30 | 2016 |
| Bermuda | 10.42 | 2015 |
| Poland | 10.49 | 2015 |
| Denmark | 10.74 | 2014 |
| Hungary | 10.77 | 2016 |
| Latvia | 11.13 | 2015 |
| Belgium | 11.23 | 2015 |
| Estonia | 11.50 | 2013 |
| Malaysia | 11.61 | 2016 |
| Qatar | 11.63 | 2016 |
| Saudi Arabia | 11.68 | 2016 |
| Netherlands | 11.73 | 2016 |
| British Virgin Islands | 11.74 | 2015 |
| Uruguay | 11.76 | 2015 |
| Cyprus | 11.92 | 2015 |
| Costa Rica | 11.98 | 2016 |
| Italy | 12.03 | 2015 |
| Bahrain | 12.06 | 2016 |
| Israel | 12.09 | 2015 |
| Sweden | 12.10 | 2015 |
| Lebanon | 12.18 | 2016 |
| Germany | 12.22 | 2015 |
| Tuvalu | 12.72 | 2015 |
| Ukraine | 12.76 | 2016 |
| Malta | 13.03 | 2016 |
| Cayman Islands | 13.04 | 2013 |
| Dominica | 13.08 | 2016 |
| Spain | 13.19 | 2015 |
| Lithuania | 13.23 | 2016 |
| Portugal | 13.31 | 2015 |
| Finland | 13.32 | 2016 |
| Barbados | 13.35 | 2016 |
| Hong Kong | 13.68 | 2016 |
| Croatia | 13.70 | 2015 |
| Monaco | 13.71 | 2016 |
| Gibraltar | 13.71 | 2016 |
| Macao | 13.86 | 2016 |
| St. Kitts and Nevis | 13.87 | 2016 |
| Puerto Rico | 13.90 | 2015 |
| Indonesia | 13.98 | 2016 |
| Seychelles | 13.99 | 2016 |
| Suriname | 14.19 | 2016 |
| Antigua and Barbuda | 14.33 | 2015 |
| Macedonia | 14.41 | 2015 |
| United States | 14.46 | 2015 |
| New Zealand | 14.50 | 2015 |
| St. Vincent and the Grenadines | 14.51 | 2016 |
| Serbia | 14.52 | 2016 |
| St. Lucia | 15.13 | 2016 |
| Turks and Caicos Islands | 15.21 | 2003 |
| Slovakia | 15.25 | 2015 |
| Grenada | 15.45 | 2016 |
| Azerbaijan | 15.49 | 2016 |
| Ireland | 16.06 | 2012 |
| Japan | 16.18 | 2015 |
| Tunisia | 16.18 | 2016 |
| China | 16.55 | 2016 |
| South Korea | 16.55 | 2015 |
| Thailand | 16.88 | 2015 |
| Slovenia | 16.90 | 2015 |
| Iraq | 16.96 | 2007 |
| Argentina | 17.23 | 2008 |
| Bosnia and Herzegovina | 17.29 | 2016 |
| United Kingdom | 17.39 | 2014 |
| Moldova | 17.42 | 2016 |
| Singapore | 17.44 | 2009 |
| Trinidad and Tobago | 17.58 | 2009 |
| Bulgaria | 17.61 | 2016 |
| Mauritius | 17.79 | 2016 |
| France | 18.18 | 2013 |
| Albania | 18.20 | 2016 |
| Peru | 18.32 | 2016 |
| Belarus | 18.34 | 2016 |
| Bolivia | 18.36 | 2016 |
| Jordan | 18.36 | 2016 |
| Chile | 18.38 | 2015 |
| Turkey | 18.41 | 2015 |
| Dominican Republic | 18.52 | 2016 |
| Czech Republic | 18.93 | 2013 |
| Bahamas | 19.03 | 2016 |
| Armenia | 19.31 | 2007 |
| Romania | 19.33 | 2016 |
| Vietnam | 19.63 | 2016 |
| Federated States of Micronesia | 19.71 | 2015 |
| Oman | 19.91 | 2003 |
| Russia | 20.14 | 2015 |
| Belize | 20.51 | 2016 |
| North Korea | 20.53 | 2015 |
| Kazakhstan | 20.76 | 2017 |
| Nepal | 20.91 | 2017 |
| Uzbekistan | 21.15 | 2017 |
| Cabo Verde | 21.48 | 2016 |
| Brazil | 21.52 | 2015 |
| Guatemala | 21.74 | 2016 |
| Tonga | 21.86 | 2015 |
| Panama | 21.89 | 2015 |
| Myanmar | 22.04 | 2017 |
| Tajikistan | 22.30 | 2017 |
| Botswana | 22.62 | 2013 |
| Laos | 22.96 | 2016 |
| Egypt | 23.08 | 2016 |
| Guyana | 23.16 | 2012 |
| Sri Lanka | 23.17 | 2016 |
| Equatorial Guinea | 23.23 | 2015 |
| Palestinian | 23.85 | 2016 |
| Paraguay | 24.16 | 2012 |
| Colombia | 24.23 | 2016 |
| Algeria | 24.24 | 2016 |
| United Arab Emirates | 24.52 | 2016 |
| Gabon | 24.53 | 2011 |
| Kyrgyzstan | 25.03 | 2016 |
| Ecuador | 25.10 | 2017 |
| Solomon Islands | 25.15 | 2016 |
| Syria | 25.33 | 2002 |
| Jamaica | 25.61 | 2016 |
| Kiribati | 25.73 | 2016 |
| Vanuatu | 26.57 | 2015 |
| Morocco | 26.59 | 2016 |
| Mexico | 26.74 | 2016 |
| Iran | 26.77 | 2015 |
| Yemen | 26.93 | 2016 |
| Ghana | 27.30 | 2017 |
| Eswatini | 27.58 | 2015 |
| Comoros | 27.81 | 2013 |
| Fiji | 28.00 | 2012 |
| El Salvador | 28.26 | 2016 |
| Honduras | 28.37 | 2016 |
| Mongolia | 29.69 | 2016 |
| Namibia | 29.78 | 2010 |
| Nicaragua | 30.22 | 2010 |
| Samoa | 30.24 | 2010 |
| Philippines | 30.27 | 2015 |
| South Africa | 30.33 | 2015 |
| Djibouti | 30.42 | 2017 |
| Liberia | 30.45 | 2015 |
| Kenya | 30.65 | 2015 |
| Sao Tome and Principe | 31.16 | 2017 |
| Timor-Leste | 31.35 | 2011 |
| Senegal | 31.74 | 2016 |
| Democratic Republic of the Congo | 33.20 | 2015 |
| Lesotho | 33.76 | 2016 |
| Bangladesh | 33.94 | 2016 |
| India | 35.22 | 2016 |
| Somalia | 35.52 | 2007 |
| Niger | 36.26 | 2016 |
| Mauritania | 36.37 | 2016 |
| Zimbabwe | 36.41 | 2013 |
| Sierra Leone | 37.33 | 2016 |
| Nigeria | 37.55 | 2010 |
| Bhutan | 38.04 | 2016 |
| Gambia | 38.68 | 2017 |
| Mali | 39.09 | 2016 |
| Nauru | 40.18 | 2016 |
| Madagascar | 40.61 | 2016 |
| Togo | 41.40 | 2016 |
| Burkina Faso | 41.55 | 2016 |
| Cote d’Ivoire | 42.50 | 2016 |
| Cambodia | 42.53 | 2016 |
| Angola | 42.54 | 2011 |
| Uganda | 42.72 | 2016 |
| Cameroon | 42.74 | 2016 |
| Tanzania | 43.06 | 2014 |
| Eritrea | 43.34 | 2015 |
| Afghanistan | 44.30 | 2017 |
| Republic of the Congo | 44.44 | 2012 |
| Benin | 45.04 | 2015 |
| Papua New Guinea | 45.17 | 2012 |
| Guinea | 45.59 | 2014 |
| South Sudan | 46.75 | 2015 |
| Pakistan | 47.63 | 2016 |
| Zambia | 47.95 | 2013 |
| Burundi | 49.66 | 2016 |
| Guinea-Bissau | 51.93 | 2010 |
| Mozambique | 54.66 | 2015 |
| Ethiopia | 55.07 | 2011 |
| Chad | 56.89 | 2016 |
| Rwanda | 58.46 | 2016 |
| Malawi | 69.51 | 2015 |
| Central African Republic | 83.41 | 2016 |
Know more:
Related maps: