What are the biggest exports of USA and to what countries?
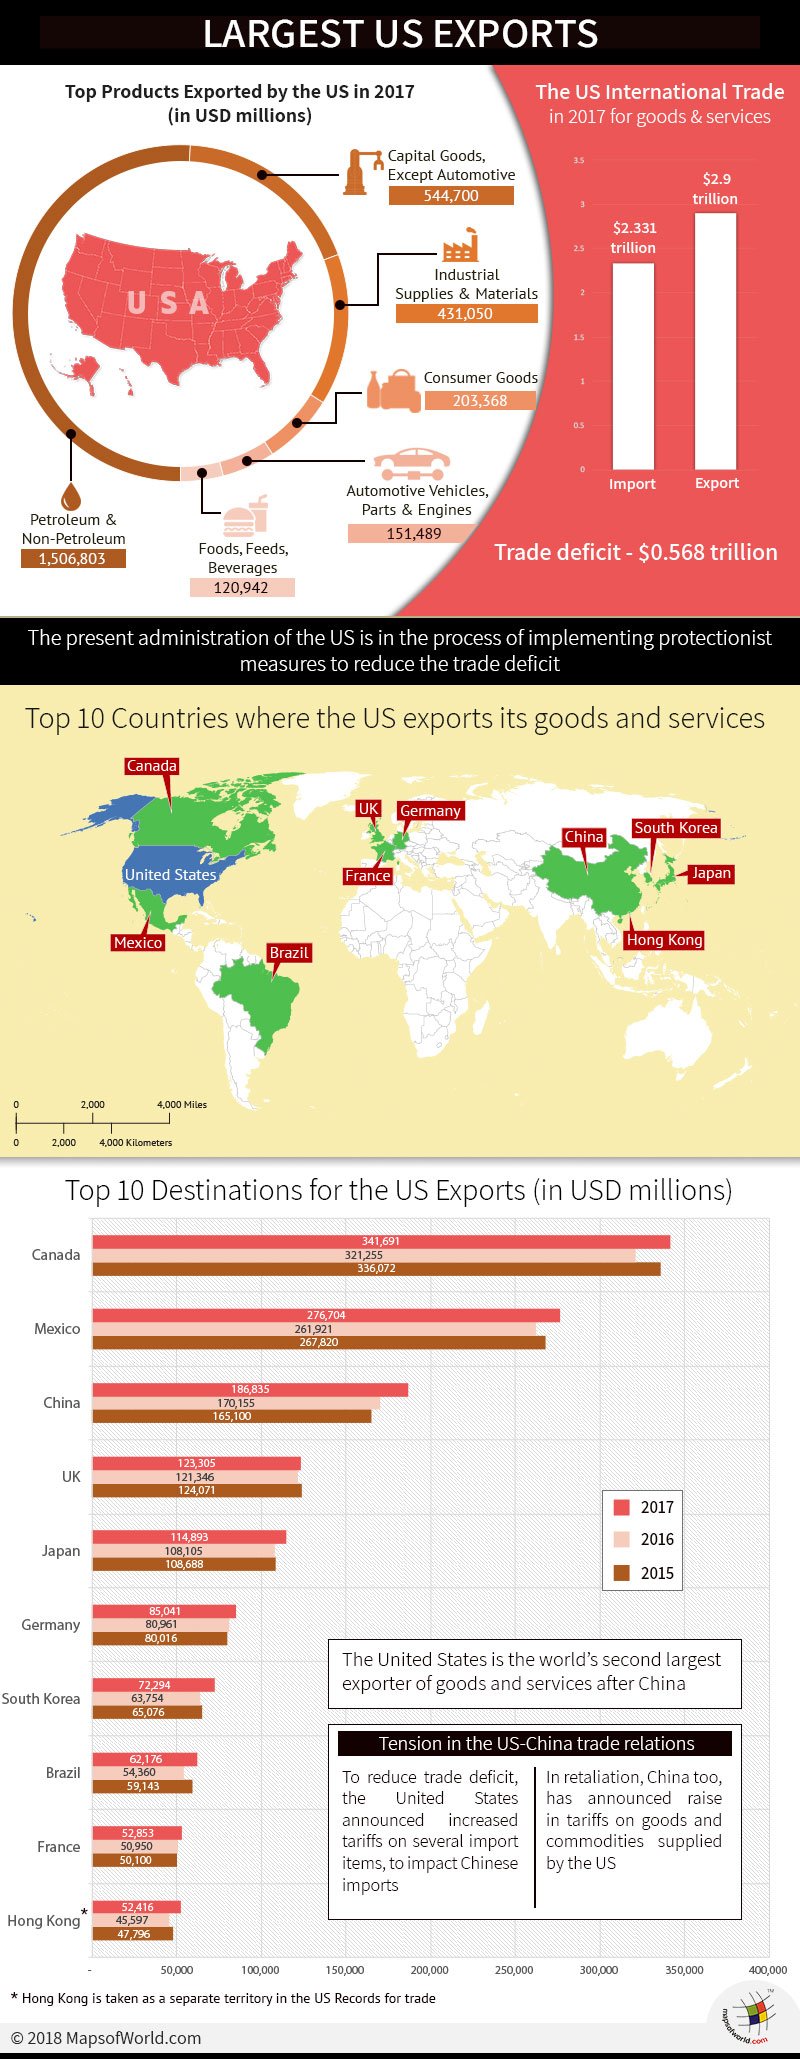 In 2017, the U.S. international trade touched $5.231 trillion, this includes the total export and import of goods and services. The total exports of USA were $2.331 trillion and, total imports were $2.900 trillion.
The United States is the world’s second-largest exporter of goods and services after China but is also the largest importer. The United States has been facing a high trade deficit, and therefore the present administration is in the process of implementing protectionist measures to reduce the trade deficit.
| Top 15 Destinations for U.S Exports (in the U.S $ million) | |||||||||
| Country | Goods & Services | Goods | Services | ||||||
| 2017 | 2016 | 2015 | 2017 | 2016 | 2015 | 2017 | 2016 | 2015 | |
| Canada | 341,691 | 321,255 | 336,072 | 282,974 | 267,298 | 281,562 | 58,717 | 53,957 | 54,510 |
| Mexico | 276,704 | 261,921 | 267,820 | 243,452 | 229,876 | 236,286 | 33,251 | 32,045 | 31,604 |
| China | 186,835 | 170,155 | 165,100 | 130,797 | 115,998 | 116,563 | 56,038 | 54,157 | 48,537 |
| UK | 123,305 | 121,346 | 124,071 | 56,630 | 55,617 | 56,511 | 66,675 | 65,729 | 67,560 |
| Japan | 114,893 | 108,105 | 108,688 | 68,714 | 63,951 | 63,942 | 46,179 | 44,154 | 44,746 |
| Germany | 85,041 | 80,961 | 80,016 | 53,481 | 49,323 | 50,033 | 31,560 | 31,638 | 29,983 |
| South Korea | 72,294 | 63,754 | 65,076 | 49,060 | 42,698 | 44,430 | 23,234 | 21,055 | 20,645 |
| Brazil | 62,176 | 54,360 | 59,143 | 36,891 | 30,022 | 31,498 | 25,285 | 24,338 | 27,646 |
| France | 52,853 | 50,950 | 50,100 | 33,546 | 31,276 | 30,345 | 19,307 | 19,674 | 19,755 |
| Hong Kong | 52,416 | 45,597 | 47,796 | 40,759 | 35,544 | 37,954 | 11,657 | 10,053 | 9,842 |
| India | 48,258 | 42,256 | 39,952 | 25,142 | 21,624 | 21,577 | 23,116 | 20,632 | 18,374 |
| Singapore | 47,402 | 43,312 | 42,547 | 29,400 | 26,372 | 28,223 | 18,002 | 16,940 | 14,323 |
| Taiwan | 36,164 | 38,131 | 38,263 | 26,446 | 26,434 | 25,994 | 9,718 | 11,697 | 12,269 |
| Italy | 27,745 | 25,616 | 25,461 | 18,380 | 16,756 | 16,305 | 9,365 | 8,860 | 9,157 |
| Saudi Arabia | 25,833 | 27,758 | 29,540 | 16,268 | 18,080 | 19,734 | 9,565 | 9,678 | 9,806 |
Canada is the biggest buyer of American exports buying goods and services worth $ 341.69 billion in 2017. In 2015, Canada bought goods and services worth $336.07 billion. In 2016, this dropped 4.4% to $321.25 billion before recovering in 2017.
Similarly, Mexico which is the second largest market for U.S. exports, saw a dip in purchases for the U.S. in 2016 vs. 2015, before rising to $276.74 billion in 2017.
2018 started off with uncertainty over trade with Canada and Mexico, both signatories along with the U.S. to the North American Free Trade Agreement (NAFTA). The U.S. is pushing to renegotiate the terms of NAFTA, as it believes the terms of the agreement are unfavorable to the U.S. The prevailing uncertainty is expected to impact trade with Canada and Mexico.
The maximum trade tension prevails between the United States and China. China is America’s third largest export market but is also the largest supplier of goods to the U.S. The imports by the U.S. far exceed its exports to China, and so in 2018, the United States announced increased tariffs on several import items that are expected to impact Chinese imports into the U.S.
In retaliation, China too, has announced a raise in tariffs on goods and commodities supplied by the U.S. The tariffs and counter tariffs is likely to hurt both sides and respective trade negotiators are currently engaged in trying to resolve the trade dispute from spiraling. Both are keen to avoid a trade war that will negatively impact economies in both countries, and also negatively impact the overall global trade.
Among the Top 15 export destinations of the U.S., India has recorded the largest change in 2017 vs. 2015 levels. India’s continuing status as the fastest growing economy is likely to see the U.S. emerge as a significant beneficiary for its exports, especially in the advanced technologies and energy.
The United Kingdom remains the largest recipient of U.S. services, and BREXIT notwithstanding is expected to continue to remain the largest market for U.S. services in 2018-19.
China is the fastest growing market for U.S. services. U.S. services exports rose by $7.50 billion from $48.53 billion in 2015 to $56.03 billion in 2017. India continued to be the second fastest growing market for U.S. services after China.
| Top U.S. Exports in 2017 – by Product Category (U.S. $ millions) | |
| Petroleum and Non-Petroleum | 1,506,803 |
| Capital Goods, Except Automotive | 544,700 |
| Industrial Supplies and Materials | 431,050 |
| Consumer Goods | 203,368 |
| Automotive Vehicles, Parts and Engines | 151,489 |
| Foods, Feeds, Beverages | 120,942 |
| Other Goods | 59,686 |
In 2018, the United States is the world’s second-largest producer of petroleum with a 12% share of the global output. The U.S. production has been rising steadily. In 2012, the U.S. produced 1,172,965 barrels of crude oil and related products. In 2017, it has risen to 2,315,219 barrels. It remains the highest export for the U.S. recording $1,506.80 billion in 2017.
After petroleum, capital goods were the second largest export product. 2017 recorded $544.70 billion in exports, followed by industrial supplies.
| Top 15 U.S. Exports in 2017 – Goods (U.S. $ millions) | |
| Passenger Cars, new & used | 9,929 |
| Other Automotive parts and accessories | 9,895 |
| Pharmaceutical preparations | 9,519 |
| Industrial Machines | 9,021 |
| Civilian Aircraft | 8,873 |
| Petroleum Products | 8,417 |
| Semiconductors | 7,853 |
| Electrical Apparatus | 7,257 |
| Engines – Civilian Aircraft | 6,444 |
| Telecommunications Equipments | 6,127 |
| Plastic Materials | 6,049 |
| Medical Equipment | 5,838 |
| Fuel Oil | 5,652 |
| Chemicals – Other | 4,968 |
| Computer Accessories | 4,840 |
Cars, new and used, remain the single largest manufactured item exported from the U.S. The present administration is aggressively promoting the increased manufacture of passenger cars in the U.S. and is pressing manufacturers to relocate car production back to the U.S. from Mexico. Mexico has been a Major beneficiary under NAFTA and is trying to resolve trade differences with the U.S. The U.S. remains a major exporter of automotive parts although countries like China and India are beginning to emerge important players with large domestic consumption.
Pharmaceutical preparations and industrial machines are the other major export items matching cars in sales turnover.
| Top U.S. Exports in 2017 – Advanced Technology Products (U.S. $ millions) | |
| Total Exports | 51,455 |
| Aerospace | 18,038 |
| Information and Communications | 13,383 |
| Electronics | 7,098 |
| Life Science | 4,467 |
| Biotechnology | 3,799 |
| Flexible Manufacturing | 2,863 |
| Optoelectronics | 636 |
| Advanced Materials | 493 |
| Weapons | 411 |
| Nuclear Technology | 267 |
The U.S. remains a world leader in innovation, research, and development of advanced technologies. Aerospace along with information technologies give it the technological edge and commercial advantage over other competitors. The domestic manufacturing industry is dominated by U.S. defense manufacturers and despite being the world’s largest exporter of arms, and therefore certain sales are not reflected in the figures above on account of confidentiality.
China remains the fastest growing challenger to the United States domination in high technology and electronics and is expected to increase their share of global trade at the expense of the U.S.
Visit the following to learn more about the USA:
Related Maps: