What countries have the highest school life expectancy rates?
The world today has more knowledge than ever, but the lack of inclusive accessibility has led to crippling of education system in the attainment of its desired goal. At the backdrop of the alarming exigencies of education, various international organizations have taken it upon themselves to address this concern. Proclaiming education as a force multiplier, the United Nations has incorporated ‘Inclusive and Equitable Quality Education and Promote Lifelong Learning Opportunities for All’, as Sustainable Development Goal IV of its Agenda 2030. The policy interventions ensure completion of primary and secondary education by all boys and girls, as well as guarantee inclusive accessibility to both technical and vocational education.
The way to measure these efforts, the School Life Expectancy Rates are accounted by UNESCO Institute for Statistics. It is measured as the total number of years of schooling (primary to tertiary), a child of school entering age is expected to receive during his lifetime, assuming the school enrollment rates to be constant. UNESCO has recognized education as a basic human right and foundation to build global peace and sustainable development.
Countries have varying parameters to base the education content or quality in a grade or a year. But the factors attributing to the levels of school life expectancy are primarily similar.
The demographics of an area affects the school enrollment rates. A low birth rate further decreases the enrollment rate at primary levels. Additionally, an area experiencing migration will have lower enrollment rates at primary levels.
The level of unemployment of a region, largely determines the school enrollment rates in both primary and secondary levels. A poverty-stricken population will have lesser number of enrollment rates and less students pursuing higher studies.
The reform policies of a nation influence the number of school years. In case of India, the implementation of schemes like “mid-day meals”, have increased the number of school years for children enrolled in primary grades. It attracts the families below poverty line to send their children to schools.
The transition from the primary school to secondary also results in large drop outs. The shift towards more autonomy is not always welcomed by the already enrolled students, thus leading to a decrease in the school life years. The need for employment at younger years and the failure in promotion to the next grade also conditions the number of drop outs.
The trend of home schooling has been subjected to debate. The dissatisfaction with the academic curriculum and multiple vocational opportunities have led to pulling out of school children leading to decrease in school years.
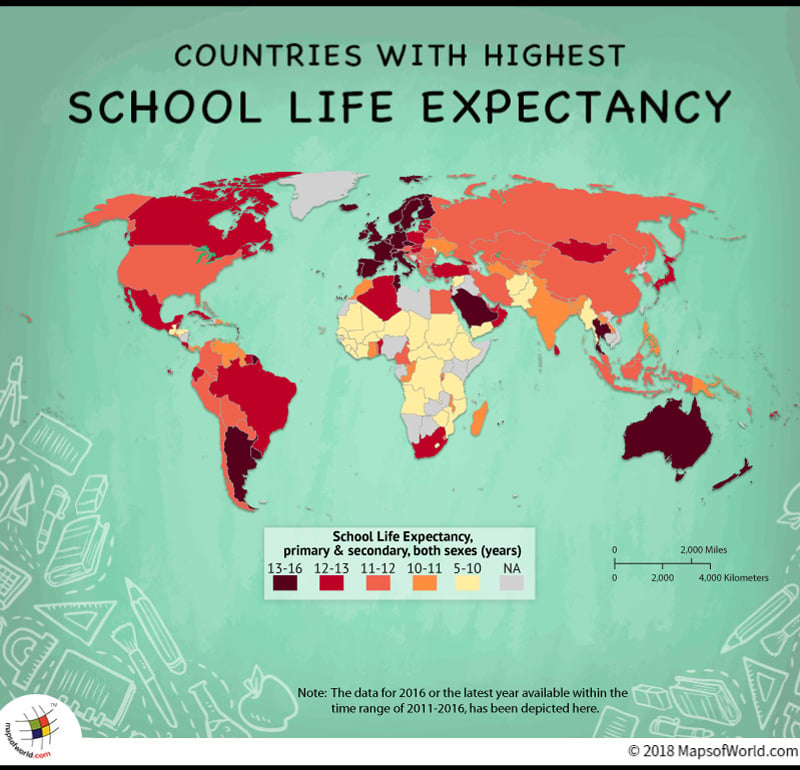
Australia, ranks the highest in the school life expectancy rates (15.8 years), owing to its evolution as an international education hub. Education has thus become third largest economic sector for Australia. The country’s openness and commitment to multiculturalism has also attracted international students.
The Scandinavian countries, grounded in the welfare-state ideology, believe in inclusiveness and equitable opportunities for all students. They show high School Life Expectancy Rates, ranging from 14.37years-15.13 years. The national curricula of the Scandinavian countries are student oriented including creativity, collaboration and communication.
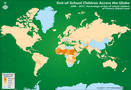
On the other hand, African countries like South Sudan, Niger, Chad, Sudan, Djibouti face education crisis, with one-in-three chidden still out of school. The stalling of primary education and lack of basic literacy, deprives them of opportunities to escape poverty. The gulf between the African countries and the rest of the world has led to a learning deficit in these nations, starving the firms and economy of a comprehensive skill development and economic growth.
Below lying is a table depicting the School Life Expectancy Rates around the World-:
|
Countries |
School Life |
Years |
Countries |
School Life |
Years |
|
|
Australia |
15.81 |
2016 |
Nepal |
11.61 |
2016 |
|
|
Niue |
15.7 |
2015 |
Romania |
11.6 |
2016 |
|
|
Belgium |
15.64 |
2015 |
Bulgaria |
11.57 |
2016 |
|
|
Curaçao |
15.62 |
2013 |
Colombia |
11.57 |
2016 |
|
|
Sweden |
15.13 |
2015 |
Iran |
11.57 |
2015 |
|
|
Iceland |
15.1 |
2015 |
Sao Tome and Principe |
11.56 |
2016 |
|
|
Denmark |
14.79 |
2016 |
Burundi |
11.55 |
2016 |
|
|
Finland |
14.67 |
2016 |
Tokelau |
11.55 |
2016 |
|
|
United Kingdom |
14.66 |
2015 |
Qatar |
11.52 |
2016 |
|
|
Ireland |
14.37 |
2016 |
Uzbekistan |
11.43 |
2016 |
|
|
Netherlands |
14.1 |
2016 |
Vanuatu |
11.42 |
2015 |
|
|
Saudi Arabia |
14.07 |
2014 |
Russia |
11.41 |
2016 |
|
|
New Zealand |
13.9 |
2016 |
Belarus |
11.4 |
2016 |
|
|
Tuvalu |
13.86 |
2015 |
Togo |
11.4 |
2011 |
|
|
Norway |
13.8 |
2016 |
Indonesia |
11.39 |
2016 |
|
|
Spain |
13.74 |
2016 |
Egypt |
11.37 |
2016 |
|
|
Palau |
13.66 |
2014 |
Malaysia |
11.3 |
2016 |
|
|
Slovenia |
13.49 |
2015 |
Timor-Leste |
11.26 |
2016 |
|
|
Tunisia |
13.39 |
2016 |
Macedonia |
11.25 |
2015 |
|
|
Seychelles |
13.35 |
2016 |
Nauru |
11.14 |
2016 |
|
|
Switzerland |
13.35 |
2016 |
Bahamas |
11.13 |
2016 |
|
|
Italy |
13.28 |
2015 |
Peru |
11.11 |
2016 |
|
|
Liechtenstein |
13.26 |
2016 |
Bolivia |
11.09 |
2016 |
|
|
Czechia |
13.25 |
2015 |
eswatini |
11.07 |
2015 |
|
|
Portugal |
13.25 |
2016 |
Paraguay |
11.01 |
2012 |
|
|
France |
13.16 |
2015 |
India |
10.99 |
2016 |
|
|
Uruguay |
13.13 |
2015 |
Kyrgyzstan |
10.99 |
2016 |
|
|
Thailand |
13.12 |
2015 |
Malawi |
10.93 |
2016 |
|
|
Dominica |
13.1 |
2015 |
Barbados |
10.92 |
2016 |
|
|
Argentina |
13.08 |
2015 |
Cabo Verde |
10.86 |
2016 |
|
|
Germany |
13.04 |
2015 |
Antigua and Barbuda |
10.83 |
2015 |
|
|
Luxembourg |
13 |
2015 |
Morocco |
10.82 |
2012 |
|
|
Malta |
12.96 |
2016 |
Ghana |
10.81 |
2016 |
|
|
Brunei Darussalam |
12.95 |
2016 |
Comoros |
10.79 |
2014 |
|
|
Ecuador |
12.92 |
2016 |
Dominican Republic |
10.78 |
2016 |
|
|
Sri Lanka |
12.91 |
2016 |
Rwanda |
10.76 |
2016 |
|
|
Suriname |
12.86 |
2015 |
Ukraine |
10.76 |
2014 |
|
|
Oman |
12.82 |
2016 |
Bangladesh |
10.74 |
2016 |
|
|
Poland |
12.8 |
2016 |
Guyana |
10.72 |
2012 |
|
|
Canada |
12.79 |
2016 |
Armenia |
10.64 |
2015 |
|
|
Algeria |
12.77 |
2011 |
Solomon Islands |
10.6 |
2012 |
|
|
Brazil |
12.72 |
2015 |
Papua New Guinea |
10.5 |
2012 |
|
|
Tonga |
12.7 |
2014 |
El Salvador |
10.47 |
2016 |
|
|
Costa Rica |
12.68 |
2016 |
Palestine |
10.44 |
2016 |
|
|
Cook Islands |
12.62 |
2016 |
Bermuda |
10.43 |
2015 |
|
|
Mauritius |
12.62 |
2016 |
Puerto Rico |
10.41 |
2015 |
|
|
Saint Vincent and the Grenadines |
12.59 |
2016 |
Turkmenistan |
10.4 |
2014 |
|
|
Fiji |
12.52 |
2012 |
Philippines |
10.36 |
2015 |
|
|
Israel |
12.49 |
2016 |
Singapore |
10.35 |
2016 |
|
|
Hong Kong |
12.48 |
2016 |
Panama |
10.34 |
2015 |
|
|
Turkey |
12.44 |
2015 |
Laos |
10.22 |
2016 |
|
|
Samoa |
12.43 |
2016 |
Madagascar |
10.13 |
2016 |
|
|
Georgia |
12.39 |
2016 |
Venezuela |
10.1 |
2016 |
|
|
Latvia |
12.36 |
2015 |
Congo |
10.06 |
2012 |
|
|
South Africa |
12.3 |
2015 |
Tajikistan |
10.06 |
2013 |
|
|
Estonia |
12.29 |
2015 |
Marshall Islands |
9.97 |
2016 |
|
|
San Marino |
12.24 |
2012 |
Lesotho |
9.91 |
2016 |
|
|
Lithuania |
12.2 |
2016 |
Zimbabwe |
9.9 |
2013 |
|
|
Bahrain |
12.18 |
2016 |
Sierra Leone |
9.75 |
2016 |
|
|
Mexico |
12.18 |
2016 |
Afghanistan |
9.72 |
2015 |
|
|
Mongolia |
12.15 |
2016 |
Moldova |
9.67 |
2015 |
|
|
Belize |
12.13 |
2016 |
Mozambique |
9.35 |
2015 |
|
|
Hungary |
12.13 |
2016 |
Guatemala |
9.31 |
2016 |
|
|
Grenada |
12.12 |
2016 |
Democratic Republic of the Congo |
9.25 |
2015 |
|
|
United Arab Emirates |
12.12 |
2016 |
Côte d’Ivoire |
9.11 |
2016 |
|
|
Cuba |
12.08 |
2015 |
Angola |
9.1 |
2011 |
|
|
Albania |
12.07 |
2016 |
Honduras |
9.05 |
2016 |
|
|
Japan |
12.06 |
2015 |
Liberia |
9.03 |
2015 |
|
|
Montenegro |
12.06 |
2016 |
Lebanon |
8.93 |
2016 |
|
|
Slovakia |
12.06 |
2015 |
Yemen |
8.66 |
2016 |
|
|
Macao |
12.04 |
2016 |
Guinea |
8.52 |
2014 |
|
|
Benin |
12.01 |
2015 |
Senegal |
8.47 |
2016 |
|
|
Austria |
11.99 |
2016 |
Ethiopia |
8.27 |
2015 |
|
|
British Virgin Islands |
11.98 |
2015 |
Myanmar |
8.25 |
2014 |
|
|
China |
11.95 |
2013 |
Burkina Faso |
8.2 |
2016 |
|
|
Kazakhstan |
11.92 |
2016 |
Pakistan |
8.1 |
2016 |
|
|
Chile |
11.91 |
2016 |
Mauritania |
8.05 |
2016 |
|
|
Cyprus |
11.9 |
2015 |
Tanzania |
7.93 |
2013 |
|
|
Kuwait |
11.89 |
2015 |
Central African Republic |
7.42 |
2016 |
|
|
Republic of Korea |
11.84 |
2015 |
Mali |
7.16 |
2016 |
|
|
Aruba |
11.8 |
2012 |
Syrian Arab Republic |
6.95 |
2013 |
|
|
United States of America |
11.77 |
2015 |
Chad |
6.87 |
2016 |
|
|
Serbia |
11.73 |
2016 |
Sudan |
6.71 |
2015 |
|
|
Cameroon |
11.72 |
2016 |
Djibouti |
6.28 |
2016 |
|
|
Croatia |
11.72 |
2016 |
Niger |
6.09 |
2016 |
|
|
Greece |
11.64 |
2015 |
Eritrea |
5.23 |
2015 |
|
|
Bhutan |
11.63 |
2016 |
South Sudan |
5 |
2015 |
Know more:
- Countries with the lowest population in primary education
- Gross enrollment ratio in secondary education
Related maps: