What countries are the top exporters of soft drinks?
 The myriad flavors of soft drinks available in market these days, are a hit with worldwide population. The tastes range from fruit flavors to even teriyaki flavored carbonated drinks. It might not be a healthy choice to opt for a Coca-Cola to quench your thirst after a meal, but people are succumbed to the bottled refreshments.
The origination can be traced back to the medieval Middle East, when fruit-flavored drinks were served widely. These drinks were sweetened by the inclusion of ingredients like sugar, syrup and honey. In the Tudor period, a sweet lemon flavored drink, with a tint of tartar cream was quite popular in England. Lemonade, a drink which is loved even today on a hot summer day, was one of the favorites back then as well. However, it was in the 18th century that Joseph Priestly, an English chemist, developed carbonated water. What came next was the ample varieties of drinks, and increased production around the world.
Today, soft drinks are manufactured in numerous countries across the globe. While some of the drinks are favorites of people around the world, for example Pepsi and Coca Cola, some are limited to suit the taste buds of people of particular regions. In year 2017, the global sale of soft drinks reached up to US $19.8 billion, with European continent having the highest export.
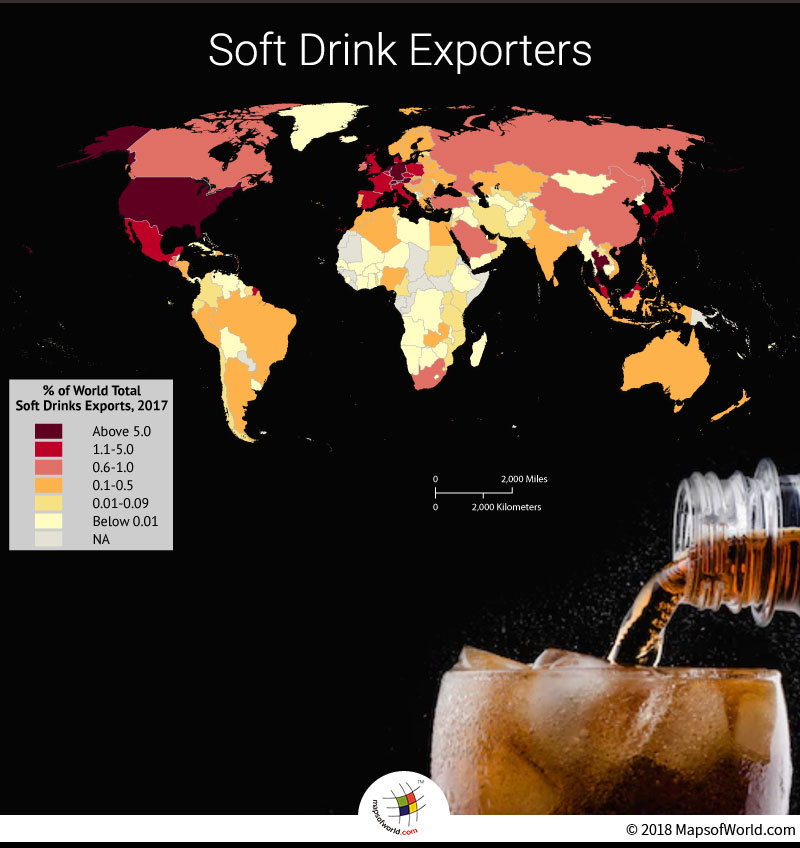
Austria exported 13.9% of world’s total exports of soft drinks, collecting US $ 2.7 billion. Apart from Coca-Cola and PepsiCo companies, which originated in the USA, the international market for soft-drink is dominated by Asahi Soft Drinks of Japan, Cott from Canada, Perrier from France and Vitasoy from Hong Kong. They are only a few names amid the soft-drink giant brands.
The drinks are called ‘soft’ in contrast to alcoholic drinks which are referred as ‘hard drinks’. People indulge in soft drinks even when they wish to add a twist to their liquor. Other names for soft drinks in different regions are: cold drink, fizzy drink, lolly water, pop, soda etc. Numerous health complications have been associated with high intake of these drinks, for example obesity, hypertension, type 2 diabetes and less nutritional level in body, which is why it is always advised to not drink them on a regular basis.
The table below mentions the percentage of export by each country in 2017:
| Country | 2017 Soft drinks exports (US$) | % World total |
| Austria | $2.7 billion | 13.9% |
| Switzerland | $1.84 billion | 9.3% |
| Germany | $1.81 billion | 9.1% |
| Netherlands | $1.7 billion | 8.6% |
| Thailand | $1.3 billion | 6.6% |
| United States of America | $1.2 billion | 6.3% |
| Belgium | $840.3 million | 4.2% |
| France | $780.1 million | 3.9% |
| United Kingdom | $553 million | 2.8% |
| Italy | $513.5 million | 2.6% |
| Poland | $397.5 million | 2.0% |
| South Korea | $388.6 million | 2.0% |
| Denmark | $371 million | 1.9% |
| Mexico | $370.6 million | 1.9% |
| Malaysia | $325.6 million | 1.6% |
| Spain | $266.6 million | 1.3% |
| Japan | $218.7 million | 1.1% |
| Czech Republic | $215.2 million | 1.1% |
| Hungary | $189.9 million | 1.0% |
| China | $180.9 million | 0.9% |
| Taiwan | $179 million | 0.9% |
| Canada | $172.3 million | 0.9% |
| Turkey | $162.8 million | 0.8% |
| South Africa | $150.9 million | 0.8% |
| Saudi Arabia | $150 million | 0.8% |
| Guatemala | $136.5 million | 0.7% |
| Russia | $128.8 million | 0.7% |
| El Salvador | $126.2 million | 0.6% |
| Hong Kong | $124 million | 0.6% |
| Ireland | $116.3 million | 0.6% |
| Serbia | $105.2 million | 0.5% |
| Sweden | $102.3 million | 0.5% |
| Indonesia | $101.3 million | 0.5% |
| Philippines | $101.1 million | 0.5% |
| New Zealand | $91.7 million | 0.5% |
| Portugal | $89.4 million | 0.5% |
| United Arab Emirates | $76.7 million | 0.4% |
| Vietnam | $76.1 million | 0.4% |
| Romania | $71.8 million | 0.4% |
| Singapore | $71.7 million | 0.4% |
| Croatia | $52.5 million | 0.3% |
| Australia | $49.1 million | 0.2% |
| Slovenia | $47.3 million | 0.2% |
| Zambia | $45.6 million | 0.2% |
| Ukraine | $42.2 million | 0.2% |
| Trinidad and Tobago | $38.6 million | 0.2% |
| Costa Rica | $37.6 million | 0.2% |
| Kazakhstan | $36 million | 0.2% |
| Greece | $35.7 million | 0.2% |
| Kuwait | $33.3 million | 0.2% |
| Luxembourg | $30.5 million | 0.2% |
| Argentina | $28 million | 0.1% |
| Bulgaria | $26.4 million | 0.1% |
| Bosnia and Herzegovina | $24.7 million | 0.1% |
| Egypt | $24.6 million | 0.1% |
| Slovakia | $23.4 million | 0.1% |
| Lebanon | $23.2 million | 0.1% |
| Lithuania | $21.4 million | 0.1% |
| Latvia | $20.1 million | 0.1% |
| Finland | $20.1 million | 0.1% |
| Peru | $18.8 million | 0.1% |
| Georgia | $17.9 million | 0.1% |
| Bangladesh | $16.8 million | 0.1% |
| Dominican Republic | $16.2 million | 0.1% |
| Belarus | $15.6 million | 0.1% |
| Sri Lanka | $15.4 million | 0.1% |
| Jamaica | $14.1 million | 0.1% |
| India | $14.0 million | 0.1% |
| Algeria | $13.0 million | 0.1% |
| Nigeria | $12.3 million | 0.1% |
| Morocco | $12.2 million | 0.1% |
| Brazil | $12.2 million | 0.1% |
| Nicaragua | $12.1 million | 0.1% |
| Norway | $10.8 million | 0.1% |
| Honduras | $10.4 million | 0.1% |
| Jordan | $9.4 million | 0.05% |
| Oman | $9.2 million | 0.05% |
| Laos | $8.7 million | 0.04% |
| Colombia | $8.6 million | 0.04% |
| Uganda | $8.4 million | 0.04% |
| Estonia | $8.2 million | 0.04% |
| Kenya | $8.1 million | 0.04% |
| Macedonia | $7.8 million | 0.04% |
| Macao | $6.1 million | 0.03% |
| Cyprus | $5.3 million | 0.03% |
| Chile | $5 million | 0.03% |
| Israel | $5 million | 0.03% |
| Sudan | $4 million | 0.02% |
| Moldova | $3.7 million | 0.02% |
| Malta | $3.6 million | 0.02% |
| Tunisia | $3.5 million | 0.02% |
| Suriname | $3.3 million | 0.02% |
| Bahrain | $3 million | 0.02% |
| Ecuador | $3 million | 0.02% |
| Armenia | $3 million | 0.02% |
| Uzbekistan | $2.6 million | 0.01% |
| Saint Lucia | $2.6 million | 0.01% |
| Kyrgyzstan | $2.6 million | 0.01% |
| Bhutan | $2.4 million | 0.01% |
| Mozambique | $2 million | 0.01% |
| Saint Vincent and the Grenadines | $1.9 million | 0.01% |
| Togo | $1.8 million | 0.01% |
| Cameroon | $1.5 million | 0.01% |
| Swaziland | $1.5 million | 0.01% |
| Tanzania | $1.2 million | 0.01% |
| Mauritius | $1.2 million | 0.01% |
| Iran | $1.2 million | 0.01% |
| Barbados | $1.1 million | 0.01% |
| Palestine | $986,000 | 0.01% |
| Pakistan | $959,000 | 0.01% |
| Ghana | $840,000 | 0.00% |
| Fiji | $838,000 | 0.00% |
| Zimbabwe | $828,000 | 0.00% |
| Uruguay | $784,000 | 0.00% |
| Haiti | $739,000 | 0.00% |
| Guyana | $662,000 | 0.00% |
| Democratic Republic of the Congo | $629,000 | 0.00% |
| Panama | $628,000 | 0.00% |
| Namibia | $525,000 | 0.00% |
| Iceland | $466,000 | 0.00% |
| Benin | $397,000 | 0.00% |
| Saint Kitts and Nevis | $332,000 | 0.00% |
| Azerbaijan | $327,000 | 0.00% |
| Curaçao | $246,000 | 0.00% |
| Tajikistan | $229,000 | 0.00% |
| Albania | $225,000 | 0.00% |
| Venezuela | $188,000 | 0.00% |
| North Korea | $186,000 | 0.00% |
| Senegal | $173,000 | 0.00% |
| Myanmar | $127,000 | 0.00% |
| Madagascar | $116,000 | 0.00% |
| Angola | $107,000 | 0.00% |
| Malawi | $66,000 | 0.00% |
| Botswana | $60,000 | 0.00% |
| Qatar | $60,000 | 0.00% |
| Anguilla | $59,000 | 0.00% |
| Iraq | $58,000 | 0.00% |
| Syria | $52,000 | 0.00% |
| United States Minor Outlying Islands | $49,000 | 0.00% |
| Cambodia | $48,000 | 0.00% |
| Cuba | $44,000 | 0.00% |
| Samoa | $40,000 | 0.00% |
| Mali | $39,000 | 0.00% |
| Yemen | $34,000 | 0.00% |
| Montenegro | $31,000 | 0.00% |
| French Polynesia | $23,000 | 0.00% |
| Côte d’Ivoire | $19,000 | 0.00% |
| Lesotho | $13,000 | 0.00% |
| Dominica | $13,000 | 0.00% |
| Sierra Leone | $11,000 | 0.00% |
| Belize | $10,000 | 0.00% |
| Nepal | $9,000 | 0.00% |
| Burkina Faso | $9,000 | 0.00% |
| Andorra | $8,000 | 0.00% |
| Cook Islands | $7,000 | 0.00% |
| Libya | $7,000 | 0.00% |
| Mongolia | $6,000 | 0.00% |
| New Caledonia | $6,000 | 0.00% |
| Christmas Island | $6,000 | 0.00% |
| Bahamas | $6,000 | 0.00% |
| Cabo Verde | $6,000 | 0.00% |
| Brunei Darussalam | $6,000 | 0.00% |
| Afghanistan | $4,000 | 0.00% |
| Turks and Caicos Islands | $4,000 | 0.00% |
| Turkmenistan | $3,000 | 0.00% |
| Antigua and Barbuda | $2,000 | 0.00% |
| Ethiopia | $2,000 | 0.00% |
| Niger | $2,000 | 0.00% |
| Aruba | $2,000 | 0.00% |
| Greenland | $1,000 | 0.00% |
| Faroe Islands | $1,000 | 0.00% |
| Bolivia | $1,000 | 0.00% |
| Rwanda | $1,000 | 0.00% |