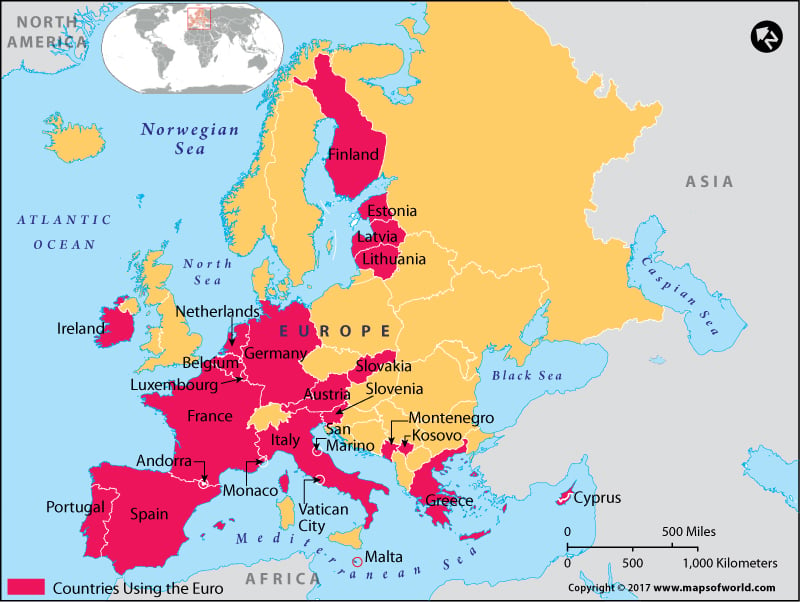
North America, Russia, Europe, Australia etc are areas where the percentage of safe drinking water access by total population is over 90%. In China, most of South America, India etc the percentage of safe drinking water access by total population is 75-90%. White drops have been used to indicate areas where water availability is under 80 litre per person per day. The white drops can be seen in all the developing countries. As can be seen in the Safe Drinking Water Availability Map, blue drops have been used to show areas where water availability is under 320 litre per person per day. It is so in all the developed countries.
Access to safe water can be measured by the number of people who have a reasonable means of getting sufficient water that is safe for drinking. Availability of safe drinking water is an indicator of the health of a country. A developed country will be more efficient in collecting, cleaning and distributing water to consumers. It is a sad fact but is true that ninety percent of urban sewage in the developing world is discharged into rivers and other water bodies. In the developing world, millions of residents lack a source of safe drinking water near their homes. People get safe drinking water from various sources such as household connection, borehole, protected dug well, public standpipe etc.
Availability of Safe Drinking Water (%), 2015 | |
| Country | (% of population with access) |
|---|---|
| American Samoa | 100 |
| Andorra | 100 |
| Armenia | 100 |
| Australia | 100 |
| Austria | 100 |
| Bahrain | 100 |
| Barbados | 100 |
| Belarus | 100 |
| Belgium | 100 |
| Belize | 100 |
| Bhutan | 100 |
| Bosnia and Herzegovina | 100 |
| Canada | 100 |
| Croatia | 100 |
| Cyprus | 100 |
| Czech Republic | 100 |
| Denmark | 100 |
| Estonia | 100 |
| Finland | 100 |
| France | 100 |
| French Polynesia | 100 |
| Georgia | 100 |
| Germany | 100 |
| Greece | 100 |
| Greenland | 100 |
| Guam | 100 |
| Hungary | 100 |
| Iceland | 100 |
| Israel | 100 |
| Italy | 100 |
| Japan | 100 |
| Korea, Dem. People's Rep. | 100 |
| Luxembourg | 100 |
| Malta | 100 |
| Mauritius | 100 |
| Monaco | 100 |
| Montenegro | 100 |
| Netherlands | 100 |
| New Zealand | 100 |
| Norway | 100 |
| Portugal | 100 |
| Qatar | 100 |
| Romania | 100 |
| Singapore | 100 |
| Slovak Republic | 100 |
| Slovenia | 100 |
| Spain | 100 |
| Sweden | 100 |
| Switzerland | 100 |
| Tonga | 100 |
| Turkey | 100 |
| United Arab Emirates | 100 |
| United Kingdom | 100 |
| Uruguay | 100 |
| Virgin Islands (U.S.) | 100 |
| Argentina | 99 |
| Bulgaria | 99 |
| Chile | 99 |
| Egypt, Arab Rep. | 99 |
| Kuwait | 99 |
| Latvia | 99 |
| Lebanon | 99 |
| Macedonia, FYR | 99 |
| Maldives | 99 |
| New Caledonia | 99 |
| Samoa | 99 |
| Serbia | 99 |
| United States | 99 |
| Antigua and Barbuda | 98 |
| Aruba | 98 |
| Bahamas, The | 98 |
| Brazil | 98 |
| Costa Rica | 98 |
| Guyana | 98 |
| Ireland | 98 |
| Malaysia | 98 |
| Northern Mariana Islands | 98 |
| Paraguay | 98 |
| Poland | 98 |
| St. Kitts and Nevis | 98 |
| Thailand | 98 |
| Tunisia | 98 |
| Tuvalu | 98 |
| Vietnam | 98 |
| Cayman Islands | 97 |
| Grenada | 97 |
| Jordan | 97 |
| Lithuania | 97 |
| Nauru | 97 |
| Russian Federation | 97 |
| Sao Tome and Principe | 97 |
| Saudi Arabia | 97 |
| Botswana | 96 |
| China | 96 |
| Fiji | 96 |
| Iran, Islamic Rep. | 96 |
| Mexico | 96 |
| Seychelles | 96 |
| Sri Lanka | 96 |
| St. Lucia | 96 |
| Ukraine | 96 |
| Albania | 95 |
| Cuba | 95 |
| Marshall Islands | 95 |
| Panama | 95 |
| St. Vincent and the Grenadines | 95 |
| Suriname | 95 |
| Trinidad and Tobago | 95 |
| Vanuatu | 95 |
| El Salvador | 94 |
| India | 94 |
| Jamaica | 94 |
| Gabon | 93 |
| Guatemala | 93 |
| Kazakhstan | 93 |
| Oman | 93 |
| South Africa | 93 |
| Venezuela, RB | 93 |
| Cabo Verde | 92 |
| Nepal | 92 |
| Philippines | 92 |
| Colombia | 91 |
| Honduras | 91 |
| Namibia | 91 |
| Pakistan | 91 |
| Bolivia | 90 |
| Comoros | 90 |
| Djibouti | 90 |
| Gambia, The | 90 |
| Kyrgyz Republic | 90 |
| Malawi | 90 |
| Syrian Arab Republic | 90 |
| Ghana | 89 |
| Micronesia, Fed. Sts. | 89 |
| Moldova | 88 |
| Azerbaijan | 87 |
| Bangladesh | 87 |
| Ecuador | 87 |
| Indonesia | 87 |
| Iraq | 87 |
| Nicaragua | 87 |
| Peru | 87 |
| Dominican Republic | 85 |
| Morocco | 85 |
| Algeria | 84 |
| Burkina Faso | 82 |
| Cote d'Ivoire | 82 |
| Lesotho | 82 |
| Myanmar | 81 |
| Solomon Islands | 81 |
| Guinea-Bissau | 79 |
| Senegal | 79 |
| Uganda | 79 |
| Benin | 78 |
| Congo, Rep. | 77 |
| Guinea | 77 |
| Mali | 77 |
| Zimbabwe | 77 |
| Burundi | 76 |
| Cambodia | 76 |
| Cameroon | 76 |
| Lao PDR | 76 |
| Liberia | 76 |
| Rwanda | 76 |
| Eswatini(Swaziland) | 74 |
| Tajikistan | 74 |
| Timor-Leste | 72 |
| Central African Republic | 69 |
| Nigeria | 69 |
| Kiribati | 67 |
| Zambia | 65 |
| Mongolia | 64 |
| Kenya | 63 |
| Sierra Leone | 63 |
| Togo | 63 |
| South Sudan | 59 |
| Eritrea | 58 |
| Haiti | 58 |
| Mauritania | 58 |
| Niger | 58 |
| West Bank and Gaza | 58 |
| Ethiopia | 57 |
| Tanzania | 56 |
| Afghanistan | 55 |
| Congo, Dem. Rep. | 52 |
| Madagascar | 52 |
| Chad | 51 |
| Mozambique | 51 |
| Angola | 49 |
| Equatorial Guinea | 48 |
| Papua New Guinea | 40 |
| Bermuda | NA |
| British Virgin Islands | NA |
| Brunei Darussalam | NA |
| Channel Islands | NA |
| Curacao | NA |
| Dominica | NA |
| Faroe Islands | NA |
| Gibraltar | NA |
| Hong Kong SAR, China | NA |
| Isle of Man | NA |
| Korea, Rep. | NA |
| Kosovo | NA |
| Libya | NA |
| Liechtenstein | NA |
| Macao SAR, China | NA |
| Palau | NA |
| Puerto Rico | NA |
| San Marino | NA |
| Sint Maarten (Dutch part) | NA |
| Somalia | NA |
| St. Martin (French part) | NA |
| Sudan | NA |
| Turkmenistan | NA |
| Turks and Caicos Islands | NA |
| Uzbekistan | NA |
| Yemen, Rep. | NA |
Last Updated on: April 28, 2017