521
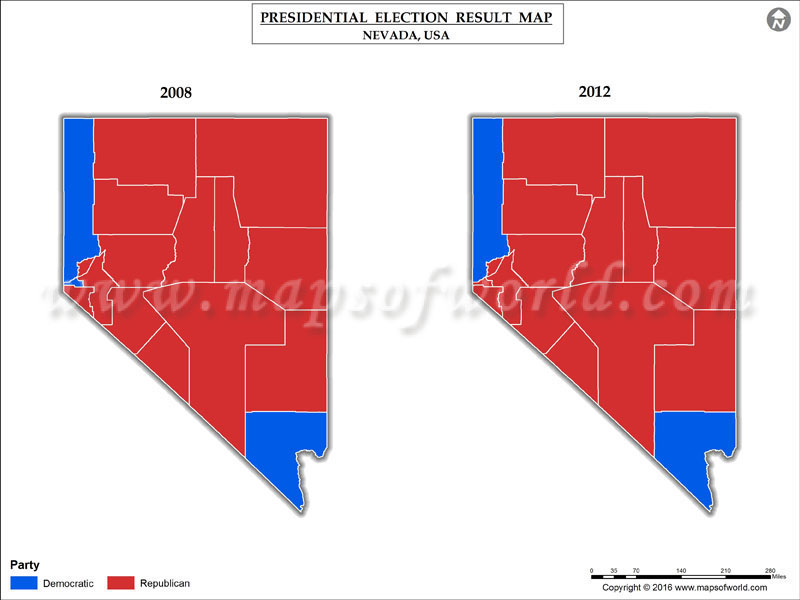
US presidential election in Nevada, 2012
| Party | Candidate | Running mate | Votes | Percentage | Electoral votes |
|---|---|---|---|---|---|
| Democratic | Barack Obama | Joe Biden | 531373 | 52.36% | 6 |
| Republican | Mitt Romney | Paul Ryan | 463567 | 45.68% | 0 |
| Libertarian | Gary Johnson | Jim Gray | 10968 | 1.08% | 0 |
| Other/None | NA | NA | 5770 | 0.57% | 0 |
| Constitution | Virgil Goode | Jim Clymer | 3240 | 0.32% | 0 |
| Totals | 1014918 | 100.01% | 6 |
US presidential election in Nevada, 2008
| Party | Candidate | Running mate | Votes | Percentage | Electoral votes |
|---|---|---|---|---|---|
| Democratic | Barack Obama | Joe Biden | 533736 | 55.15% | 5 |
| Republican | John McCain | Sarah Palin | 412827 | 42.65% | 0 |
| None of these Candidates | None of these Candidates | NA | 6267 | 0.65% | 0 |
| Independent | Ralph Nader | Matt Gonzalez | 6150 | 0.64% | 0 |
| Libertarian | Bob Barr | Wayne Allyn Root | 4263 | 0.44% | 0 |
| Constitution | Chuck Baldwin | Darrell Castle | 3194 | 0.33% | 0 |
| Green | Cynthia McKinney | Rosa Clemente | 1411 | 0.15% | 0 |
| Totals | 967848 | 100.00% | 5 |
Delegate count for each candidate in the Nevada primaries/caucuses
Delegates Republican Party 761412
Marco Rubio Ted Cruz Donald Trump John Kasich Ben Carson 051015
Delegates Democratic Party 1817
Hillary ClintonBernie Sanders 05101520
Republicans |
| Candidates | Total Votes | % Votes | Del. |
|---|---|---|---|
| Marco Rubio | 17940 | 23.9 | 7 |
| Ted Cruz | 16079 | 21.4 | 6 |
| Donald Trump | 34531 | 45.90 | 14 |
| John Kasich | 0 | 0 | 1 |
| Ben Carson | 0 | 0 | 2 |
Democrats |
| Candidates | Total Votes | % Votes | Del. |
|---|---|---|---|
| Hillary Clinton | 6316 | 52.60 | 18 |
| Bernie Sanders | 5678 | 47.3 | 17 |
US presidential election in Nevada, 2004
| Party | Candidate | Votes | Percentage | Electoral votes |
|---|---|---|---|---|
| Republican | George W. Bush (incumbent) | 418690 | 50.47% | 5 |
| Democratic | John Kerry | 397190 | 47.88% | 0 |
| Independent | Ralph Nader | 4838 | 0.58% | 0 |
| N/A | None of these Candidates | 3688 | 0.44% | 0 |
| Libertarian | Michael Badnarik | 3176 | 0.38% | 0 |
| American Independent | Michael Peroutka | 1152 | 0.14% | 0 |
| Green | David Cobb | 853 | 0.10% | 0 |
| Totals | 829587 | 100.00% | 5 |

 Virginia Election Results 2016 Map by County